Huge performance drop after upgrade to Angular 11 #41038
Comments
|
I can't tell what the root cause of this could be; there have been several changes to the Ivy Runtime between 9.1.13 and 11.2.0 but I couldn't tell if the regression you're seeing could be caused by any of them. Could you investigate if you are perhaps affected by babel/babel#11356? Is Btw, we are actively working on the rebuild performance in v11. A rebuild correctness fix has resulted in more expensive rebuilds in 11.1, see #40635 and status tracker in #40728 for more info. |
|
Angular 9: Angular 11: |
|
Thanks; that's supposedly not the cause then. Although performance profiles might hint at where the bottleneck occurs, finding the root cause would probably require bisecting to determine the version where this is introduced. Performance traces are very hard to interpret for production bundles, and even more so because of bundle (size) optimizations and JS engine optimizations such as function inlining, which can skew the results significantly. I suspect that you are in the best position to try various versions of Angular to determine which patch release introduced the regression, as we don't have the ability to build from scratch with different versions. |
|
We had problems with dev build before. After #40374 everything was ok. As I know this fix is not included in Angular 10 and some versions of Angular 11. Bisecting can be hard to do or impossible on dev mode without this patch. I'll find out if prod build works without this fix. |
|
Prod build works with our config. I'll try to do bisection. |
|
Ok, I don't have good news. Problem occurs between major version, so it can be hard to say where the problem is.
Every build was started with AOT and prod mode enabled. I was testing and recording profiles with the same data, hardware and in short period of time. I think we can assume that hardware or environment are not the problem. Main changes in package.json: Any ideas what I can check next to find the problem? |


|
Thanks for the extensive research! Did you also test the prerelease/RC versions of v10? The screenshots show |
|
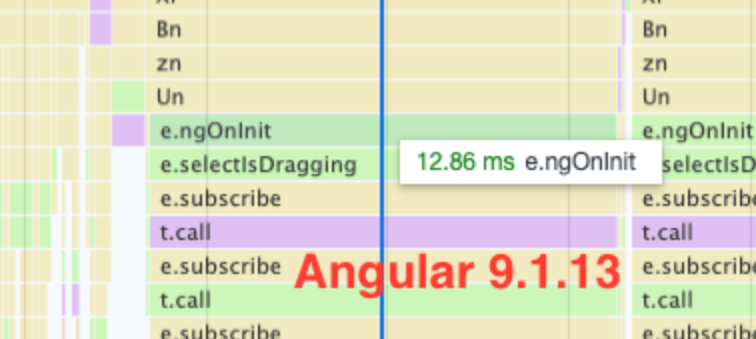
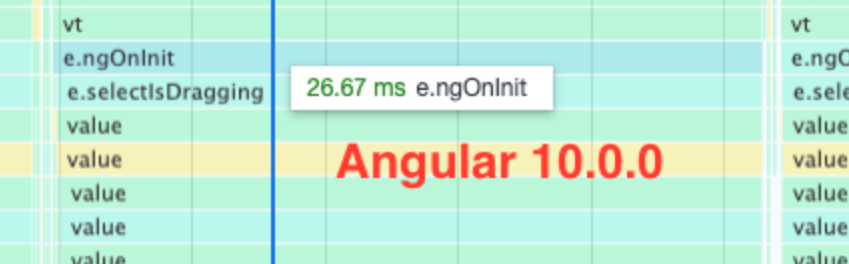
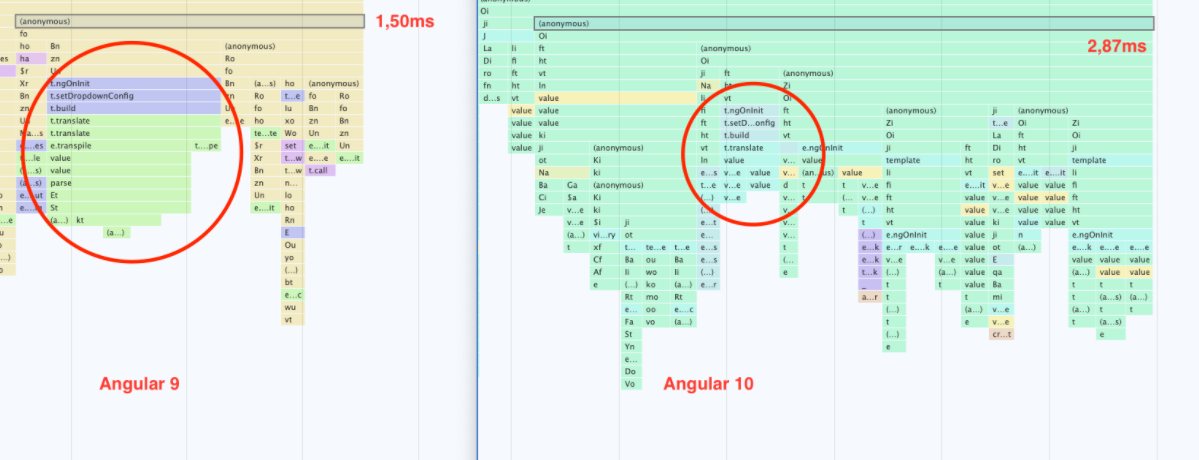
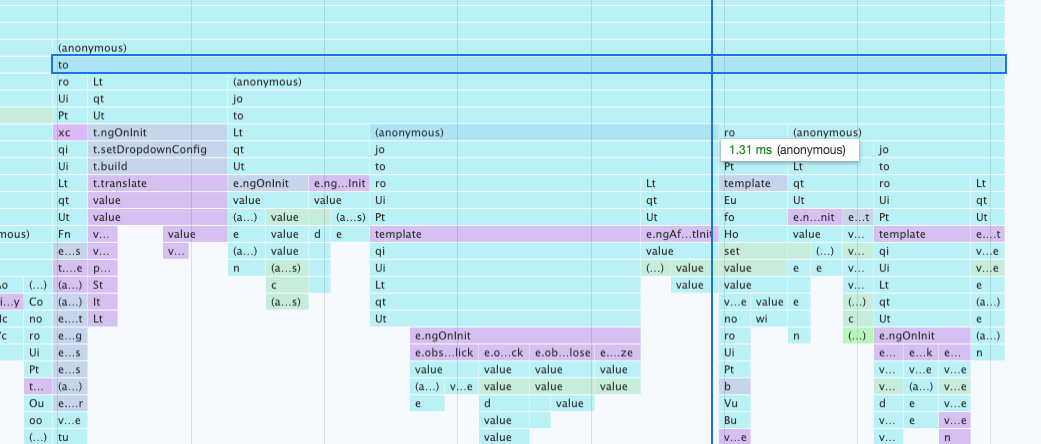
Yes, this methods are our methods. Here you will find more detailed profiles.
Second one shows one simple operation I found. Selected rectangles presents the same place of rendering code in both versions. As you can see Angular 10 performs more operations than 9. In both cases we have Ivy enabled. |

|
In both cases our project code was not changed, I forgot to mention it. |
|
@JoostK If you need I probably can send you profiles via email. |
|
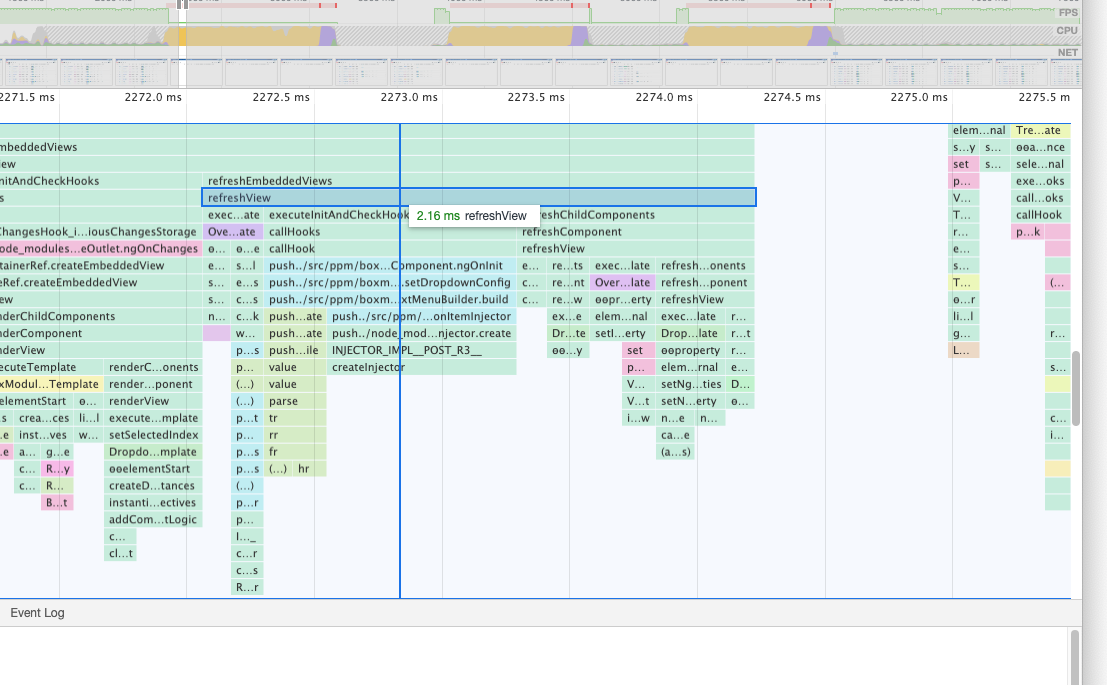
Ok, I think I have something that might be problem here. I decided to dig some more today and I've compared dev build for 9 and 11 versions.
In both cases Angular call In sources I found: It is part of I understand that using inheritance may be the problem here. Am I right? Call of Almost all our components inherit from class like this: It's strange, that this method fires. Our base component does not implement Can someone describe how it works and how inheritance can affect angular performance? I didn't found this in release notes. Can I disable I'm working on minimal env reproduction, I'll post it later. |

|
Ok, you can check it here: https://github.com/galczo5/angular-11-rendering
This |

|
Do you need more info from me? For us it's a blocker for feature upgrades of angular. |
|
Hi @galczo5, thanks for sharing additional information. I've tried to reproduce the problem using the test repository you shared. Here are some details:
Here are the results: Based on my tests, the most recent v11 version (v11.2.5) has slightly better performance than v9. Could you please try to use the mentioned version for v11-based app, run apps in Incognito mode? Also please do a few runs and pick the lowest (i.e. best, not average) result for both v9 and v11 and compare the results. |

|
@AndrewKushnir Ok. You may expect results tomorrow to the end of the day. I want to test both given minimal reproduction and our app with 11.2.5 |
|
could fix this performance issue,if not using AOT it's coast a lot of time to compile angular template,why not turn compile to on demand or lazyload #41044 |
|
I'm back with the results.
Testing setup:
App code between tests was not changed. I'm using Last test As you can see there is huge drop between 9 and 11. I've tested it with Angular 12, results was similar to Angular 11. Our project is huge and I'm afraid that it's can be impossible to reproduce it with minimal env. |

|
@joebnb We have AOT enabled in prod builds. Problem still occurs. |
could you disable aot and take a screenshot,in my cases enable aot will improve a lot. in your case it should be slower than 9/11 aot enabled. |
|
@joebnb disabling AOT is not acceptable solution for our problem. |
|
@galczo5 thanks for additional information. I don't see anything unusual on the flame charts provided. Do you see any functional differences in the app between v9 and v11.2.5? For example, more calls to lifecycle hooks that now show up in the profiler or something similar? I believe it would be also helpful to profile an app (take the same steps that you described) with Angular v10 and all minor versions for v10 and v11 (v10.1.0, v11.1.0, v11.2.0) to see if there was a performance drop at a particular version. |
|
@AndrewKushnir I've checked it before. Drop appears between
I think that this can be really our problem. I'll try to compare differences between Any helpful advices? |
|
After first analysis, problem may be connected to:
Anything important changed in ContentChild in Angular 10? |
|
Hi @galczo5, thanks for additional information. I've looked at the 10.0.0 changes in the CHANGELOG.md and there is a couple PR that might potentially be related to lifecycle hooks (#35968 and #35840), but looking at these changes I don't see anything suspicious that may cause the problem that you described.
Could you please also try different next/RC versions between 9.1.13 and 10.0.0? The versions are:
If you can help identify a specific version where the drop happened, it'd be easier to find what caused that and what the possible solutions might be. Thank you. |
|
@AndrewKushnir I'm back with the results. Prod mode enabled, AOT build. Lowest results for Times:
Hooks:
It's strange that with Angular 10 number of ngOnInit hooks is increasing but number of ngOnChanges is reduced to 50%. |
|
I know, we are warned about possible |
|
We checked our app for memory leaks. In both cases we have the same memory leaks, so it should not be the problem. Can you tell me if anything in Both in angular 11 and 9 we use the same Similar situation with polyfills, we use the same version of |
|
@galczo5 Hey I have occurred this performance problem in my team, can we get any assistant or workaround for this problem? |
|
@BrkCoder we didn't found the root of the problem. I'm still trying to debug it, but for me, it looks like everything just works slower. We will stay with angular 9 for now. If you want we can compare our cases, maybe it will reveal where the problem is. |
"core-js" should be removed from dependencies. Starting with Angular 10, "core-js" is part of Angular CLI. Version of "zone.js" depends on your Angular version (v0.9.x -> Angular v9, v0.10.x -> Angular v10, v0.11.x -> Angular v11 and so on). |
|
@galczo5 Have you solve this performance issue? We got the same problem in our application after upgrade to Angular 11. |
|
@sean-tj unfortunately no :( Everything works just normal in the clean angular CLI app. Can you try to reproduce my previous tests in this thread to confirm the problem? |
This comment has been minimized.
This comment has been minimized.
|
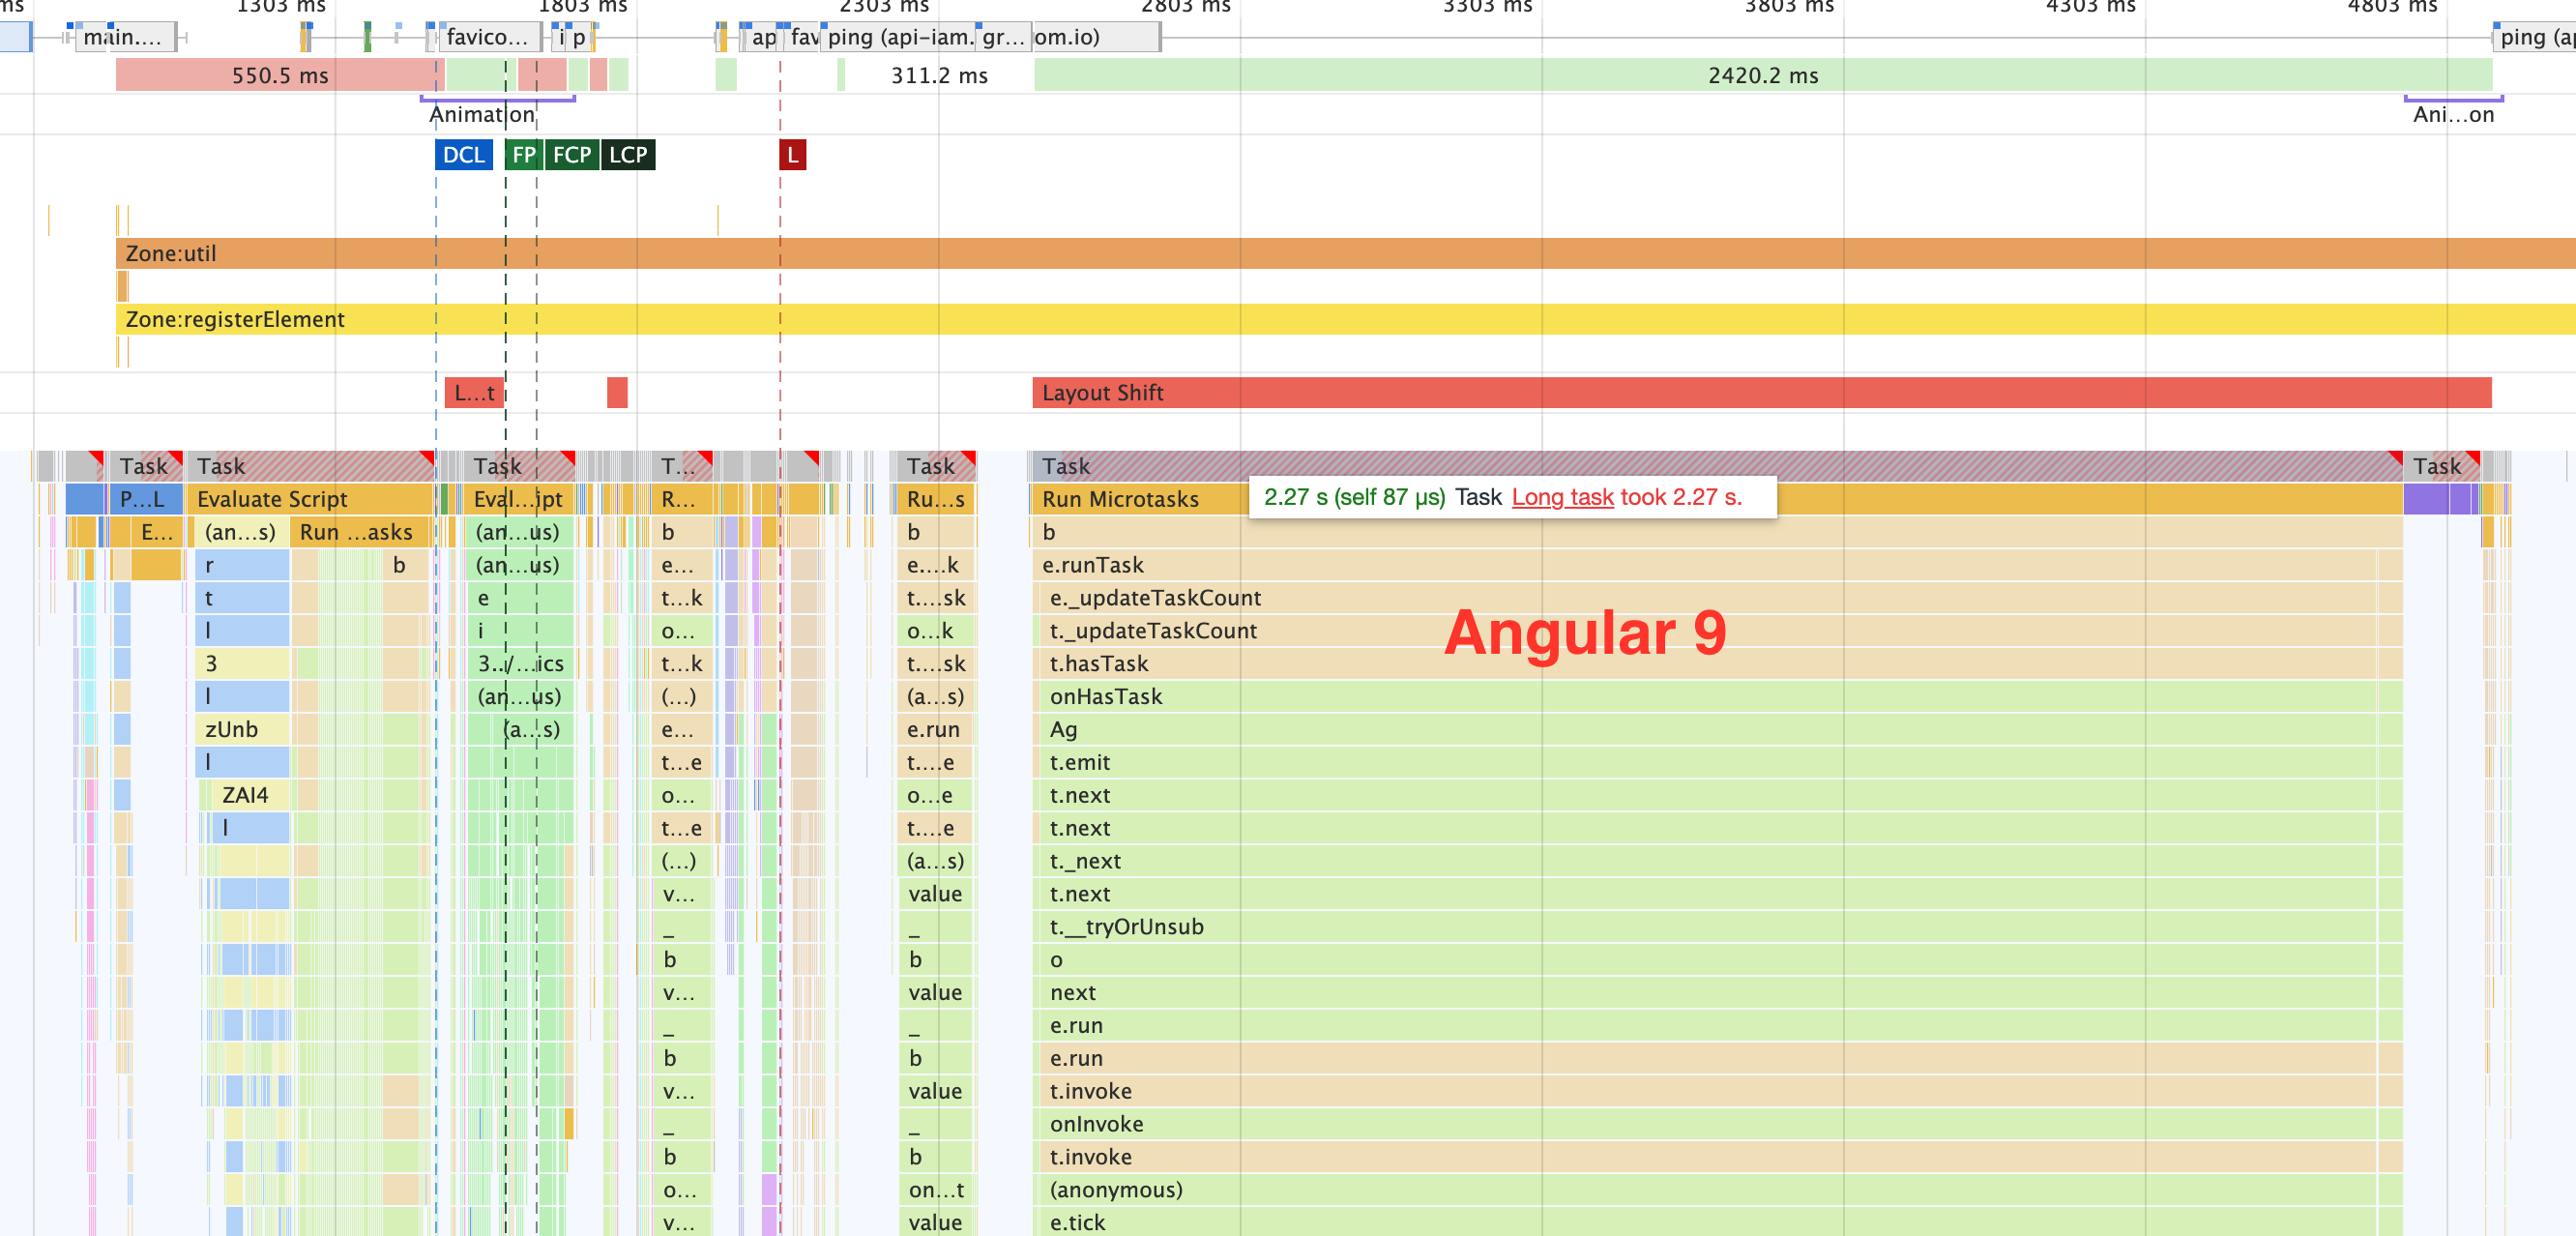
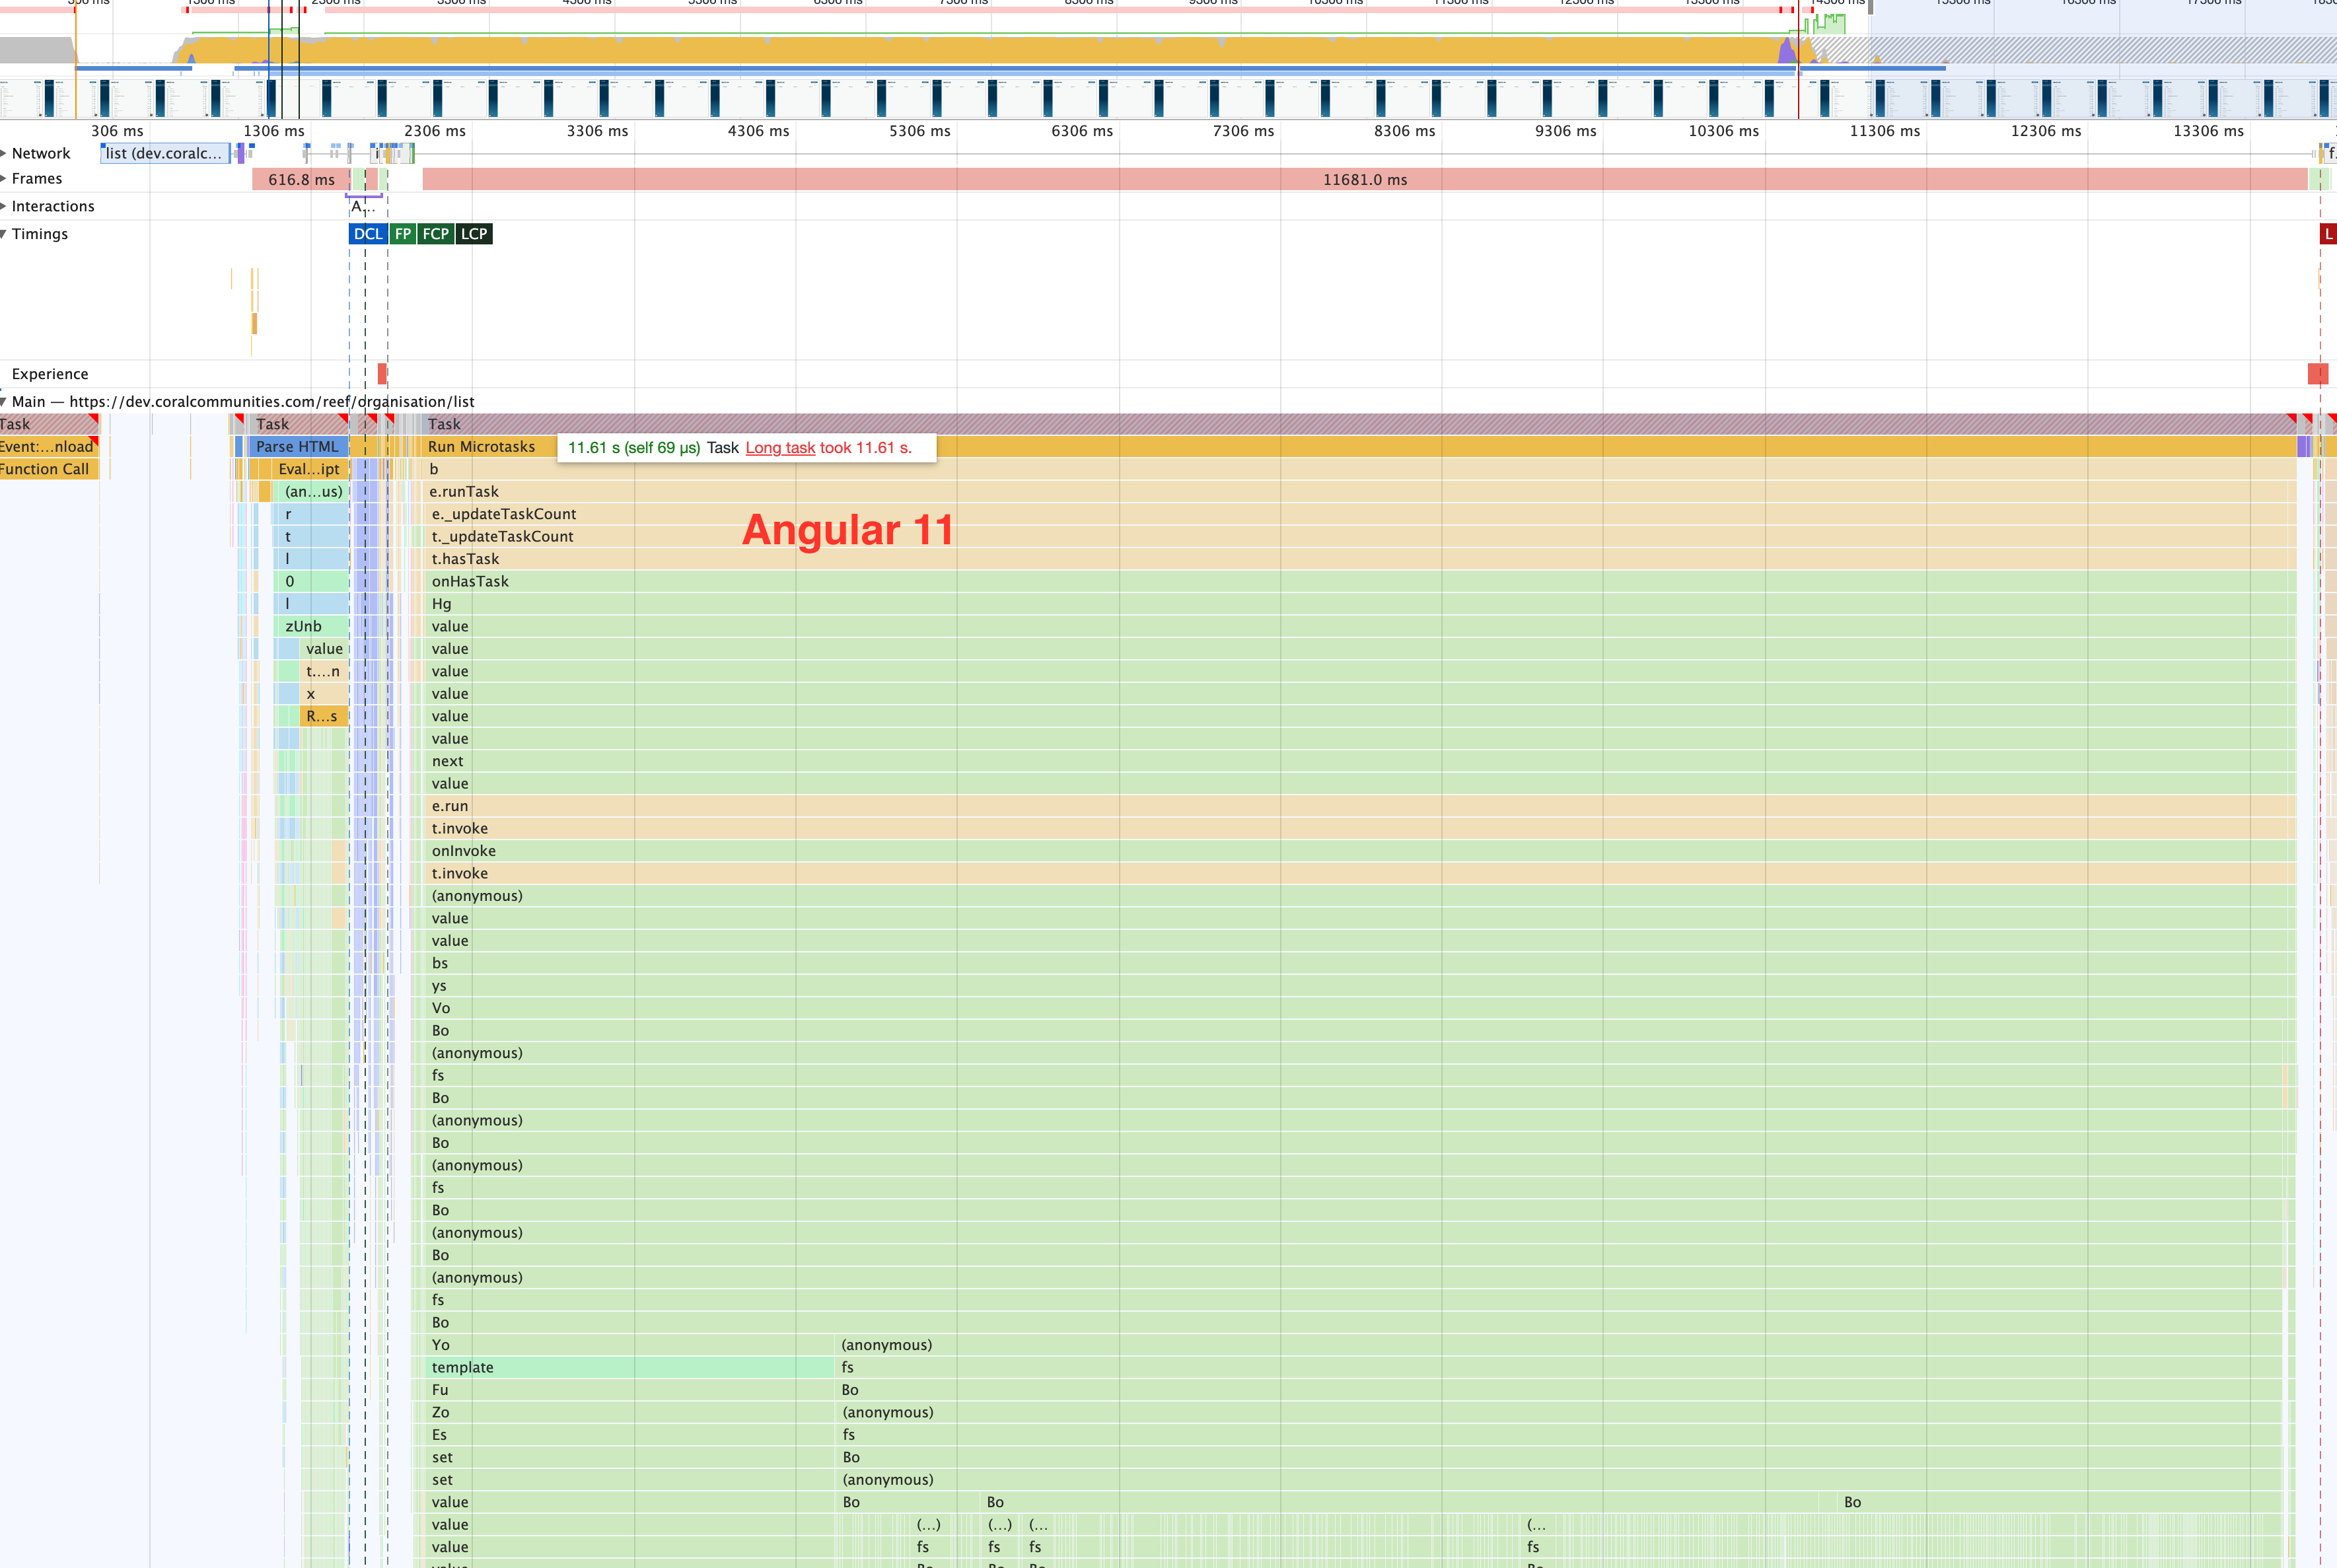
We have also seen a huge performance drop after upgrading from Angular 9 to 11. For us the problem is most noticeable in rendering tables with angular/material. I'm not a performance guru, so I'm not sure where to start when debugging this. But you can see from the attached screenshots that there is some "Task" that is taking 5 times as long with Angular 11. Hope this helps with the investigation in some way. For now we have reverted back to Angular 9 and are still looking for a workaround before we bring angular 11 to production.
|
|
@AndrewKushnir @JoostK Any idea what we can check next? We are still blocked with upgrade from 9 to 11/12. |
|
Hi @galczo5, I've performed some tests using an internal benchmarking tool that we've put together some time ago to investigate performance bottlenecks and compared v9.0.0 and v12.0.0 (and a few major/minor versions in between) and didn't find any regressions: v9 and v12 results are very close. We'd like to help more, but it's hard to make further progress without a minimal repro that we can investigate.
There is a couple things you can try next (sorry if it was already mentioned):
Thank you. |
|
Drop appears between versions 9 and 10. I was mentioned some time ago. @AndrewKushnir @JoostK If you want I can record a video with both versions. For us it's a blocker of any upgrade. 😢 |
|
@donovancarthew @sean-tj did you found any workaround? |
Thanks for additional information. Could you please try to find a specific v9 patch version (e.g. 9.1.5) that is causing the problem (by changing Angular package versions in package.json and running the app)? You can find the list of versions here: https://github.com/angular/angular/releases?after=10.0.1. Also as I described in my previous message, please try to simplify template(s) of the affected pages and see if there is a particular component/directive that is causing perf regressions. |
|
@AndrewKushnir - from reading through the previous comments it looks like the drop was between the last of the v9 patch versions (i.e. 9.1.13) and the first of the v10 pre-releases (i.e. 10.0.0-next.0). This could be very painful and slow @galczo5, but you could consider locally building versions of Angular at different commits between the point when |
|
These are the only commits (from looking through that list) that could have impacted core performance IMO: build(zone.js): update zone.js version to 0.10.3 (#36214) PR Close #36214 fix(zone.js): UNPATCHED_EVENTS and PASSIVE_EVENTS should be string[] not boolean (#36258) __zone_symbol__UNPATCHED_EVENTS and __zone_symbol__PASSIVE_EVENTS should be string[] type not boolean. PR Close #36258 fix(zone.js): should not try to patch fetch if it is not writable (#36311) Close #36142 In Firefox extensions, the So in this case, we should not try to patch PR Close #36311 fix(core): ngOnDestroy on multi providers called with incorrect context (#35840) Currently destroy hooks are stored in memory as These changes fix the issue by changing the structure of the destroy hooks to I've run the newly-added Fixes #35231. PR Close #35840 |
|
@petebacondarwin thx! I'll try to do it and I'll be back with results as soon as possible. |
|
@petebacondarwin @JoostK @AndrewKushnir Ok, I'm back with the results. So, good and bad news. Bad first. Good news. So in the end. If I'm not wrong one of angular/angular-cli@v9.0.1...v10.0.0-next.0 commits should be the problem. Should I do the binary search once again? |
That sounds like a reasonable plan. Alternatively, you may want to compare the generated bundle across the different CLI versions. Yet another idea might be to lock all Babel packages to the same version as used in v9. I linked a Babel perf issue in my initial comment here and you confirmed that you weren't affected by that, but perhaps there is other things going on. |
|
I decided to do it. By this time I have a workaround. Angular 12 compiles and works without any problem with the 9.0.1 devkit. There is only one thing that I had to do, I had to change the target from ES5 to ES2015 and solve circular dependencies. There are no performance issues, so that's great! @donovancarthew @sean-tj @BrkCoder FYI, using this method you'll have all features of Angular 12, but the whole build will be bundled with Webpack 4. I'll be back with binary search results in the next few days 😄 |
|
Ok, I'll need few more days, the results I got during manual tests with chrome performance profiles are very inconsistent. I'm going to push the upgrade into our automatic performance tests. It'll take some time but should give us better results. I'll let you know after the automatic tests end. |
|
For us we found that it actually had something to do with the @angular/flex-layout library that we were using. We were using it to position items within a table cell, for tables that had 50+ rows. Since we were only using flex-layout in a few places, we decided to replace the usage of @angular/flex-layout with just plain css flex-box. This resolved the problem for us. Not sure if this helps anyone else. |
|
@donovancarthew can you tell me which version of Our automatic performance tests are in progress so we need a few days more to confirm that the performance drop in our app disappeared. |
|
We upgraded the app to angular 12. Our automatic performance testing tools confirmed that there is no drop anymore. Thanks for all your help! 😃 |
|
@galczo5 We were using "@angular/flex-layout": "^11.0.0-beta.33"
|
|
@galczo5 thanks for the update! Great to see that the perf issue is now resolved. |
|
There were few other perf-related reports within this thread and if the problem still exists (and there is a chance that it's a framework-related perf regression), please create a new ticket with the necessary details (ideally including a repro), so that we can investigate. Thank you. |
|
This issue has been automatically locked due to inactivity. Read more about our automatic conversation locking policy. This action has been performed automatically by a bot. |
🐞 bug report
Affected Package
Hard to point, one of:
Is this a regression?
Yes
Description
After the upgrade from Angular 9 to 11 we find out that performance of component creation has declined. In our automated tests we get creation times doubled in almost every complex component. Results can be found on the image below. As you can see the main problem here is scripting time.
For testing purposes we use puppeteer to get performance profiles from Google Chrome. Every component is created dynamically. Tracing data is collected using the Tracing class from the Puppeteer library (https://pptr.dev/#?product=Puppeteer&version=v2.0.0&show=api-class-tracing). The start method is called at the beginning of each iteration of the test and the stop method is called after the test completes. Then the tracing data is parsed to determine the scripting, rendering and painting times.
Problem exists in both JIT and AOT builds with and without prod mode enabled.
Even when we tried to investigate this using a manually generated profile we found exact same results. It’s not only about numbers, we feel that our app is much slower.
This problem and really slow build time (compared to Angular 9) was the reason to downgrade back to Angular 9.
🔬 Minimal Reproduction
It’s hard to reproduce this problem in minimal env. Our example is a huge, enterprise scale app. We have a lot of performance tweaks, like:
“On Push strategy everywhere”
Noop NgZone provided
We don’t use styles encapsulation
Additionally it is good to point that we use tones of dynamically generated components.
I’ve tried to investigate the problem on a clean angular/cli project. In both (9 and 11) times of component creation are the same (https://github.com/galczo5/angular-11-rendering). Maybe it’s related to the scale of our app.
We can try to expose our whole app in prod mode for you for investigation. Please let us know if this is necessary.
If you want we can start with performance profiles.
Again please let us know as soon as possible.
🔥 Exception or Error
No exception or error.
🌍 Your Environment
Angular Version:
Angular 9:
Angular 11:
Anything else relevant?
No
The text was updated successfully, but these errors were encountered: