fill:'stack' consider dataset out of the stack #11012
Comments
|
I'm having a similar problem. My expectation was that by defining the stack group this would cause the fill behavior to be isolated to it's respective group. A possible solution (which may work for you but not for me because I have overlap), is the drawing order. So long as I draw the line last it would not get filled, but then it appears behind my other filled lines which is the opposite of what I want. |
|
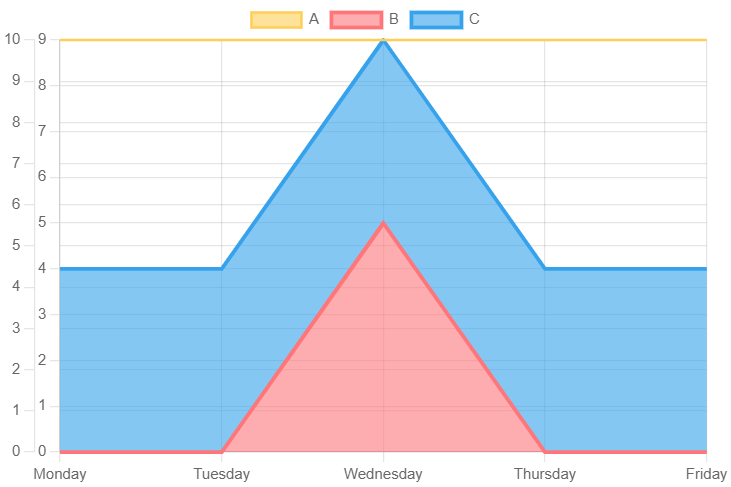
Hello @jasonjoslin, thanks for your proposal, however I cannot modify the draw order. The line dataset A is draw upfront the the area dataset B and C, to be more visible when the dataset A values are bellow the stack values, like bellow:
If you have other suggestion they are welcomed |


|
Ok, I think I figured out another possible workaround. Put Dataset A onto it's own axis. Check the fork I made on JSFiddle. It still needs some work to tidy up the axis labels and ranges, but I think it'll be possible. |
Expected behavior
When a dataset in a stack with fill
stack, only dataset of this stack should be consider as fill source.In the example bellow the datasets are on the same y axis. The y axis is stacked
true.The dataset A is in this own stack rather the dataset B and C are in the same stack.
To achieve this visual the dataset B is in fill
origininstead of stack. This is problematic since when it's hidden the problem will appear again.Current behavior
The dataset in a stack with fill
stackwill consider as source dataset in different stack from same axis.In the example bellow the dataset A is used as source to fill the area of dataset B, even if A and B are in different stack.
Reproducible sample
https://jsfiddle.net/kfqu3zts/4/
Optional extra steps/info to reproduce
No response
Possible solution
When building the stack line consider only the visible dataset in the same stack if defined.
Context
No response
chart.js version
4.1.1
Browser name and version
No response
Link to your project
No response
The text was updated successfully, but these errors were encountered: