[FEATURE] Show zero values in bar graph. #3915
Comments
|
So, since no one else has shown interest over the past day, I've taken it upon myself to come up with some idea on how it should be implemented. I'd like to get some feedback before I create a pull request with any changes. I was taking a look at the Documentation for Chart.defaults.global.elements.rectangle, and how you can edit things like the background color, and border width. I thought that that's a place where it would make sense to place this global property. I added a key called 'minSize' to globalOpts.elements.rectangle, making it look like this: This is around like 10085 in Chart.js. After that, I added this line to Then, in Chart.elements.Rectangle, I made the following changes: In order to make it work, from my code, I call Before: After: Further considerations: For bar graphs with both positive and negative values, it might make sense to take minSize, split it into two, and then use one half to drop the bottom, and the other half to raise the top (vertical bars). This would put the bar right on the zero, and is probably the most correct in terms of representation. I also considered having the value be a boolean, and instead use a predetermined minSize, but I feel like everyone can apply their own judgement as to how big the minimum bar size should be. |


|
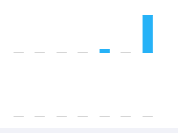
Hi, Thanks to this post, I've write a plugin to draw the little line, It looks like this when value is zero. const zeroCompensation = {
renderZeroCompensation: function (chartInstance, d) {
// get postion info from _view
const view = d._view
const context = chartInstance.chart.ctx
// the view.x is the centeral point of the bar, so we need minus half width of the bar.
const startX = view.x - view.width / 2
// common canvas API, Check it out on MDN
context.beginPath();
// set line color, you can do more custom settings here.
context.strokeStyle = '#aaaaaa';
context.moveTo(startX, view.y);
// draw the line!
context.lineTo(startX + view.width, view.y);
// bam! you will see the lines.
context.stroke();
},
afterDatasetsDraw: function (chart, easing) {
// get data meta, we need the location info in _view property.
const meta = chart.getDatasetMeta(0)
// also you need get datasets to find which item is 0.
const dataSet = chart.config.data.datasets[0].data
meta.data.forEach((d, index) => {
// for the item which value is 0, reander a line.
if(dataSet[index] === 0) {
this.renderZeroCompensation(chart, d)
}
})
}
};and here is how to add a plugin to Chart.js I've also add a answer on StackOverflowUpvote me on Stackoverflow |
|
However useful this may be to someone, I prefered this solution because it kept the colors of the data set. This works in 2.6.0. If you have any improvements, they're most welcome. PS: I have no idea how the code styling works on github |
|
Its perfect...!Great @Moghul |
|
@Moghul Great clean solution and easy integration into my project. I'm new to chart.js and I've been looking for a solution for days. Thank you! |
|
Should be fixed by #5741 |
I know this is pretty old thread, but still I am sharing my opinion. |
|
@Moghul |
|
Does minBarLenth not work as per #5741 ? |
A while ago, a fix was introduced to remove 0 value representation on bar graphs.
I understand why it was done (not wanting to show incorrect values and all that), but I need to be able to show something because in my situation, the data shown on a graph can be for the same label, but from multiple sessions (datasets).
Expected Behavior
A bar of very small size should be visible for 0 values.
Current Behavior
Currently, a value of 0, on a bar graph is not represented. However, if I mouse over it, I get my custom tooltip telling me it's 0.
Possible Solution
For my needs, something like a 'representZero' boolean (default value false) under the 'ticks' key would be an excellent feature.
Perhaps set a minimum non-zero pixel length for a bar?
Context
While in our system, a client can mouse over where the bar might be, and get a tooltip telling them the value is 0, but if they print out the graph, it's difficult to understand that there is supposed to be something there.
Environment
PS: If this is already possible, it means I have missed it in the documentation. If this is the case, I apologize and would appreciate a push in the right direction. Alternatively, if anyone else has implemented an alternative for this, I would love to have an explanation.
The text was updated successfully, but these errors were encountered: