Adjust the size of rectRounded/rectRot points to fit the circle with pointRadius #5858
Conversation
There was a problem hiding this comment.
@nagix awesome!
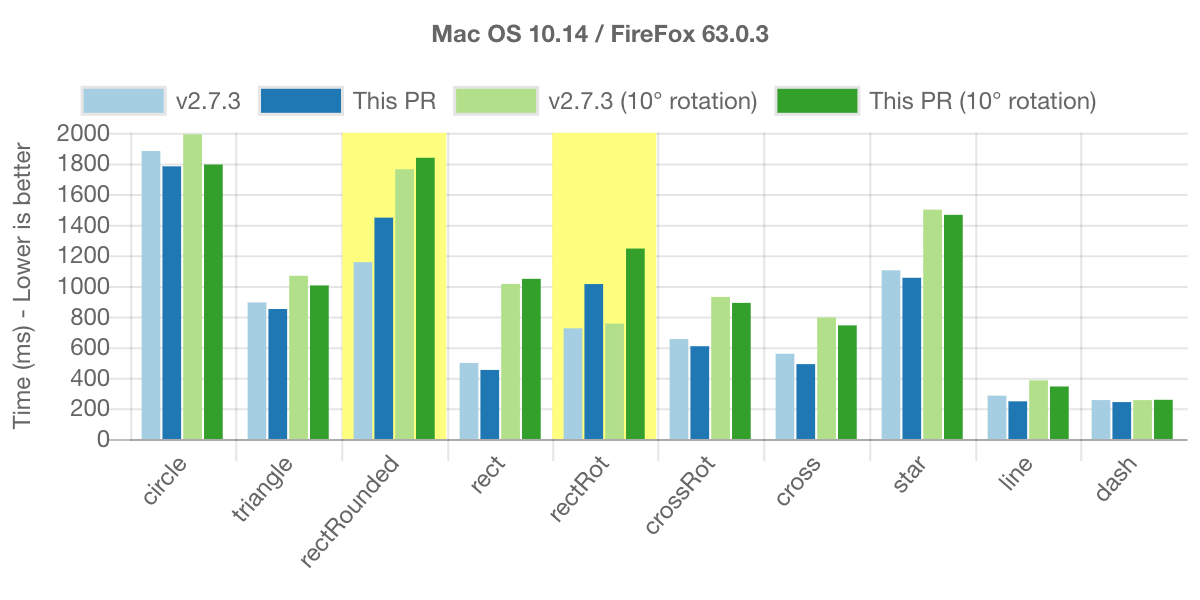
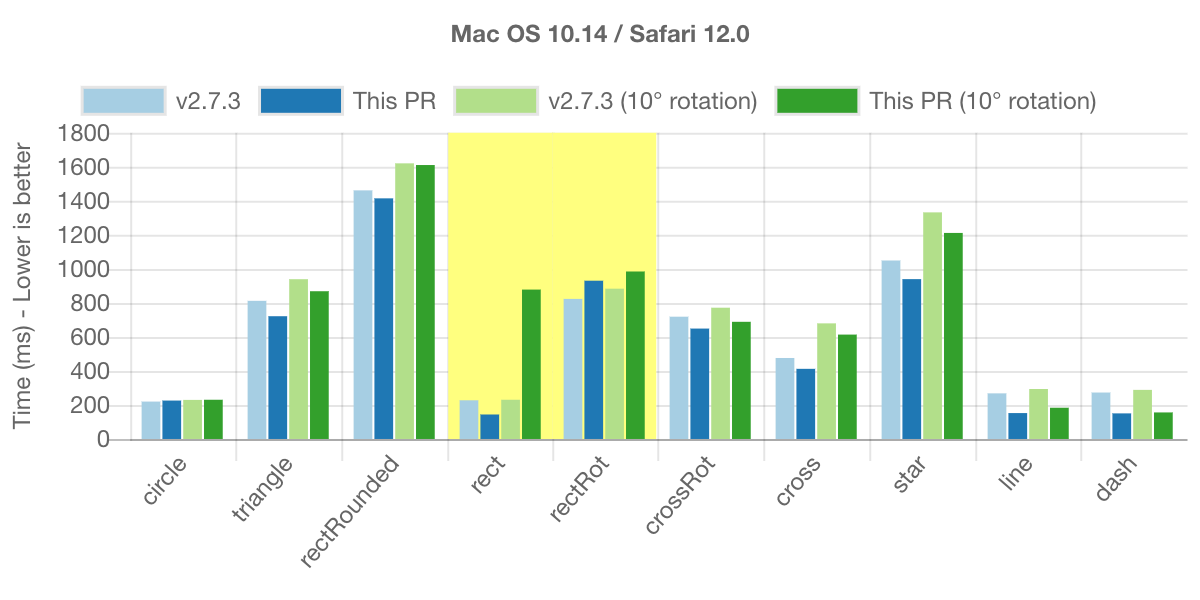
I'm wondering if we could refactor the rectRounded implementation in helpers.canvas.rectRounded() without breaking #5597. Regarding performances, drawing rotated rectangles on Safari is really slow (and slow on Firefox) compared to the previous version but I guess it's acceptable?! Results in Chrome looks a bit dubious since I think Chrome uses GPU to transform coordinates so it's strange that we are ~2 times faster doing it manually.
Could you also compare performance in IE11 and Edge? And out of curiosity, what's the Chart.min.js size before and after this PR?
|
I have added the benchmark results using Chrome, FireFox, IE11 and Edge on Windows 10 PC. The performance is improved for all the tests. Interestingly, there is also huge improvement in Chrome on Windows. It seems that Chrome has some performance problem in The size of |
|
It would be good to add a comment to the code explaining it or linking to this PR. If I read the code alone without reading the description in this PR I would not be able to follow it or understand where .516 comes from, etc. |
|
I have refactored |
|
I have also added a reference to this PR and #5597 to the comment. |
31ae280
to
7f16657
Compare
There was a problem hiding this comment.
Thanks @nagix for the extra benchmarks.
I like the new rectRounded implementation. I verified that it doesn't break chartjs-plugin-datalabels and it's fine (however, I found another unrelated issue). I thought you would have call rectRounded from drawPoint (as before) but I think it doesn't worth it since you would have to also pass the rotation, so let's keep it like you did.
- Calculate the vertices of the shapes so that they are inscribed in the circle that has the radius of `pointRadius`
- Remove `translate()` and `rotate()` to fix the regression introduced by chartjs#5319
- Refactor `rectRounded` for better performance
Yes, for the best performance, I decided not to call |
…tjs#5858)

- Calculate the vertices of the shapes so that they are inscribed in the circle that has the radius of `pointRadius`
- Remove `translate()` and `rotate()` to fix the regression introduced by chartjs#5319
- Refactor `rectRounded` for better performance
Most of the
pointStyleshapes are inscribed in the circle that has the radius ofpointRadius, but'roundedRect'and'rectRot'shapes are inscribed in the rectangle that is inscribed in the circle and they look relatively smaller than others. To achieve more consistent appearance, this PR adjusts the size of those shapes to fit the circle.This PR also fix the regression introduced by #5319 by removing
ctx.translate()andctx.rotate(), and calculating the absolute coordinates of each rendering point.Chart.js 2.7.3: https://jsfiddle.net/nagix/ye9kcxaf/
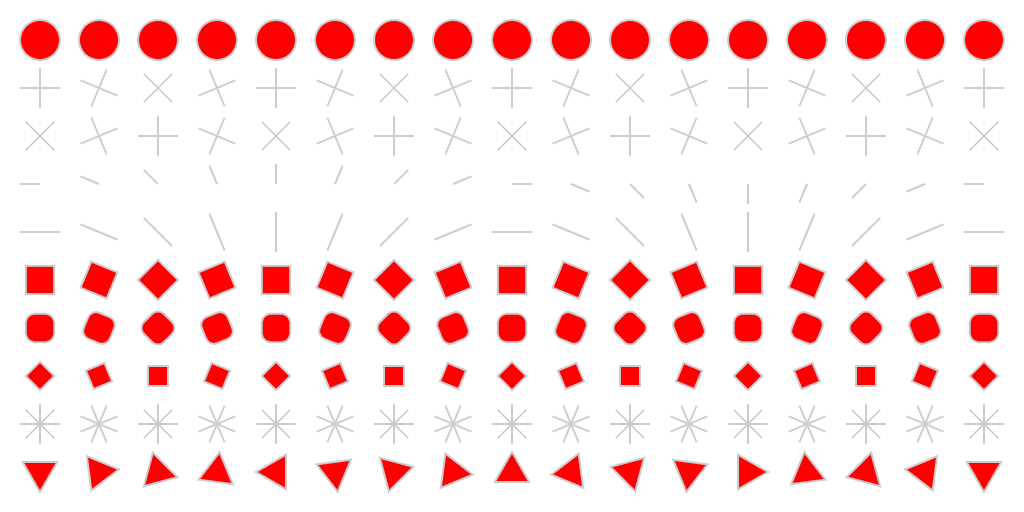
This PR: https://jsfiddle.net/nagix/6rnfspu3/

For

'roundedRect', the corner radius is calculated using a new factor of0.516which is derived from the following:Regarding the performance impact, I performed a benchmark using 50,000 random points on my MacBook and Dell laptop. The following charts show the difference from v2.7.3. The rendering time doesn't increase in most of the symbols except for
'rect'with rotation and 'rectRot'. The performance is even better with Chrome in particular.https://jsfiddle.net/nagix/4nkucft6/


Fixes #5839