Blurry chart lines #7351
Comments
|
I don't know if this is the issue, but one thought I have: Drawings on canvas need to be aligned to 0.5 pixel. |
|
HTML canvas does anti-aliasing. 1px: 1.5px: 2px: |


That one depends on the device too. With |
Is there any optimal behavior for curves or should we just ignore trying to align curves? |
The behavior of drawing "between pixels" was probably chosen to make images look better by default. It works well for anti-aliasing. Only drawback is the 1px vertical / horizontal lines that are not sharp. Translating only the h / v lines makes them half a pixel off compared to other lines. Bar chart bars could be aligned too, to make them sharper and look good both sides of the origin (origin needs to be reserved its width though). |
|
One thing to keep in mind with translating with the |
i think you'd have to poll for it, as [1] seems insufficient :( although you could bind mousewheel & key events (since |
|
I don't think there is anything more we can do about this. |
Interactive example: https://codepen.io/ZsharE/pen/NWGBpoZ
Expected Behavior
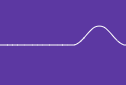
The sparkline chart should be sharp. The straight line should be white.
Current Behavior
The sparkline chart is blurry. The straight line is not white (looks like it has some kind of transparency). It's like you draw a line with a pencil that is not sharpened enough.
Steps to Reproduce (for bugs)
Go to: https://cdpn.io/ZsharE/debug/NWGBpoZ/GnAnbOoNqEZA
Browser zoom level 100%: the line chart is blurry.
Browser zoom level 125%: the line chart is sharp.

Environment
The text was updated successfully, but these errors were encountered: