Not rendered charts after update to 3.5 #9515
Comments
|
Off hand, I'm not sure what would cause this. What browser are you using? @kurkle do you think this could have been caused by the |
|
OS: Windows 10 pro, browser Chrome, for Firefox it was same |
|
Some thoughts on this (though I don't think we can solve this without some kind of codepen). If you inspect the canvas in the DOM tree, does it have a size? If you set |
|
When i change responsible to false and set some width/height on canvas it works, but that is not what i need. |
|
It could be a lot of things. Since there is nothing we can debug, you'll have to do it yourself.
|
|
Could also be same issue as #9471, are you attaching the charts with 2 or more levels of containers? |
|
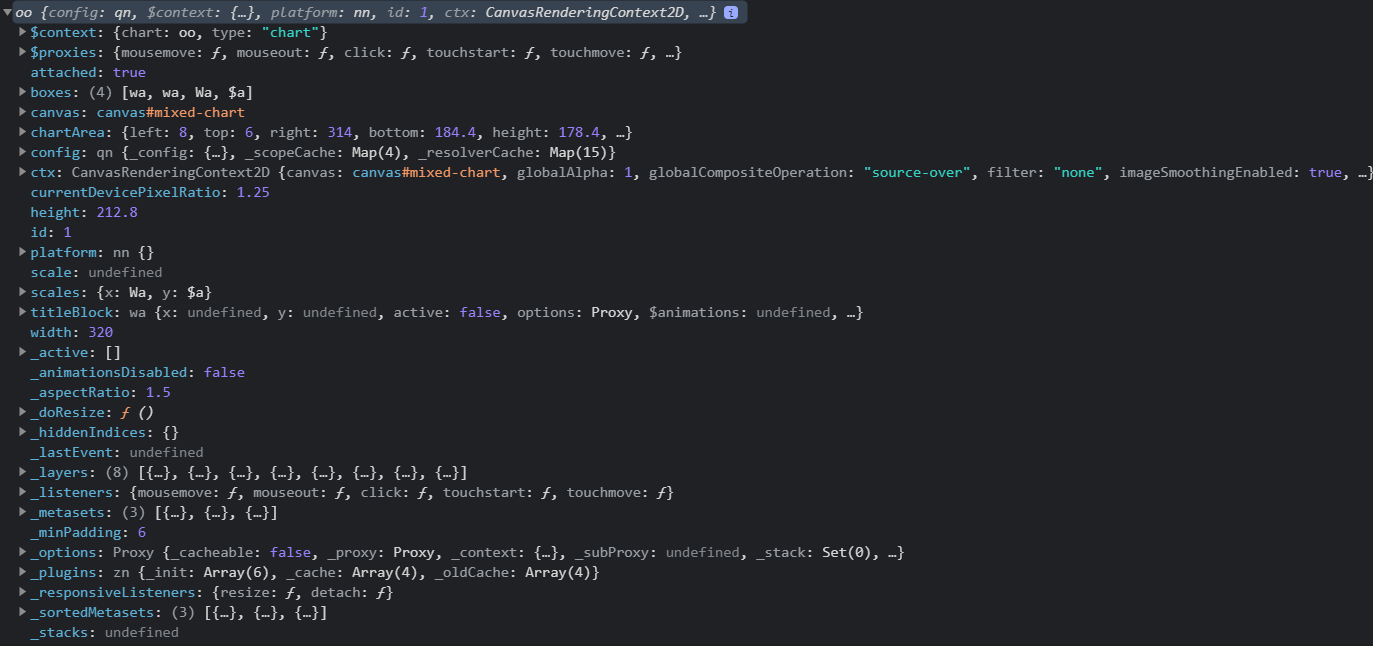
I found out that meta._clip returns undefined so clip.disabled throws exception during render (at chart.esm.js:5618). |
|
I have planned investigation for this week or next one if delayed, so il try to provide some demo if possible |
|
Hello, i found way how simulate issue. Here is simulation of version 3.5.1 where it is not working: https://stackblitz.com/edit/angular-ivy-g8euhb?file=package.json It is worth mentioning that way how first canvas parent got its proportion settings. It is through :host::ng-depp usage of component which determines sub-layout. In this example it is example.component which set height to 250px. Iam using it this way because proportions of layout are dependent on different screen sizes, so with media query it is simple to change height of charts when screen is small/medium/large/4k etc |
|
@etimberg @kurkle @TomaszP1987 any news? |
|
@PavolSvidran sorry, I was on vacation the last few weeks. I had some trouble getting the reproduce to work in FireFox, but it seems to reproduce in Chrome. The problem is definitely related to the canvas size (in 3.5.1 it shows as size (0,0). I feel like this might have been related to #9471 |
|
I did some testing on the |
|
Closing per my previous message; this will be fixed once 3.6.0 is released |
Hey,
i recently update my project to ChartJs version 3.5 from 3.4.1. My issue is that the most of the charts are not rendered, its width and height is 0px. Some charts are sometimes visible, but it is random.
Some environment description:
I tried to find solution for this issue, but there is no error, no warning, no info... just nothing includes charts.
When i change responsible to false and set some width/height on canvas it works, but that is not what i need.
Simulate exact state of project into codepen is imposible in the short amount of the time and project cannot be shared.
My question is if you have any tips, what changed between 3.4.1 and 3.5 to create this issue?
I think that it is bug, but i am not 100% sure about it.
Thanks for the help.
The text was updated successfully, but these errors were encountered: