In this sample, we'll create two java applications: a service application, which exposes two methods, and a client application which will invoke the methods from the service using Dapr. This sample includes:
- TracingDemoService (Exposes the methods to be remotely accessed)
- TracingDemoServiceController (Implements two methods:
echoandsleep) - TracingDemoMiddleServiceController (Implements two methods:
proxy_echoandproxy_sleep) - InvokeClient (Invokes the exposed methods from TracingDemoService)
Also consider getting started with observability in Dapr.
This sample uses the Client provided in Dapr Java SDK invoking a remote method and Zipkin to collect and display tracing data.
- Dapr CLI.
- Java JDK 11 (or greater):
- Apache Maven version 3.x.
- Configure Redis as a state store for Dapr.
Clone this repository:
git clone https://github.com/dapr/java-sdk.git
cd java-sdk
Then build the Maven project:
# make sure you are in the `java-sdk` directory.
mvn install
Then get into the examples directory:
cd examplesRun dapr init to initialize Dapr in Self-Hosted Mode if it's not already initialized.
Run docker ps to verify the container dapr_zipkin is running locally:
CONTAINER ID        IMAGE                  COMMAND                  CREATED             STATUS              PORTS                              NAMES
24d043379da2        daprio/dapr            "./placement"            2 days ago          Up 32 hours         0.0.0.0:6050->50005/tcp            dapr_placement
5779a0268159        openzipkin/zipkin      "/busybox/sh run.sh"     2 days ago          Up 32 hours         9410/tcp, 0.0.0.0:9411->9411/tcp   dapr_zipkin
317fef6a8297        redis                  "docker-entrypoint.s…"   2 days ago          Up 32 hours         0.0.0.0:6379->6379/tcp             dapr_redis
If Zipkin is not working, install the newest version of Dapr Cli and initialize it.
The Demo service application exposes two methods that can be remotely invoked. In this example, the service code has two parts:
In the TracingDemoService.java file, you will find the TracingDemoService class, containing the main method. The main method uses the Spring Boot´s DaprApplication class for initializing the TracingDemoServiceController. See the code snippet below:
public class TracingDemoService {
  ///...
  public static void main(String[] args) throws Exception {
    ///...
    // If port string is not valid, it will throw an exception.
    int port = Integer.parseInt(cmd.getOptionValue("port"));

    DaprApplication.start(port);
  }
}
DaprApplication.start() Method will run a Spring Boot application that registers the TracingDemoServiceController, which exposes the invoking actions as POST requests. Dapr's sidecar is the one that performs the actual call to the controller, triggered by client invocations or bindings.
This Rest Controller exposes the echo and sleep methods. The echo method retrieves metadata from the headers and prints them along with the current date in console. The actual response from method is the formatted current date. See the code snippet below:
@RestController
public class TracingDemoServiceController {
  ///...
  @PostMapping(path = "/echo")
  public Mono<String> handleMethod(@RequestBody(required = false) String body,
                                   @RequestHeader Map<String, String> headers) {
    return Mono.fromSupplier(() -> {
      try {
        String message = body == null ? "" : body;

        Calendar utcNow = Calendar.getInstance(TimeZone.getTimeZone("GMT"));
        String utcNowAsString = DATE_FORMAT.format(utcNow.getTime());

        String metadataString = headers == null ? "" : OBJECT_MAPPER.writeValueAsString(headers);

        // Handles the request by printing message.
        System.out.println(
            "Server: " + message + " @ " + utcNowAsString + " and metadata: " + metadataString);

        return utcNowAsString;
      } catch (Exception e) {
        throw new RuntimeException(e);
      }
    });
  }
}
The sleep method simply waits for one second to simulate a slow operation.
@RestController
public class TracingDemoServiceController {
  ///...
  @PostMapping(path = "/sleep")
  public void sleep() throws Exception {
    // Simulate slow processing for metrics.
    Thread.sleep(1000);
  }
  //...
}
The instrumentation for the service happens via the OpenTelemetryIterceptor class. This class uses the OpenTelemetrySDK for Java.
Use the following command to execute the service:
dapr run --app-id tracingdemo --app-port 3000 -- java -jar target/dapr-java-sdk-examples-exec.jar io.dapr.examples.tracing.TracingDemoService -p 3000Once running, the TracingDemoService is now ready to be invoked by Dapr.
This service will handle the proxy_echo and proxy_sleep methods and invoke the corresponding methods in the service above.
In the code below, the opentelemetry-context attribute is used to propagate the tracing context among service invocations in multiple layers.
@RestController
public class TracingDemoMiddleServiceController {
  // ...
  @PostMapping(path = "/proxy_echo")
  public Mono<byte[]> echo(
      @RequestAttribute(name = "opentelemetry-context") Context context,
      @RequestBody(required = false) String body) {
    InvokeMethodRequest request = new InvokeMethodRequest(INVOKE_APP_ID, "echo")
        .setBody(body)
        .setHttpExtension(HttpExtension.POST);
    return client.invokeMethod(request, TypeRef.get(byte[].class)).subscriberContext(getReactorContext(context));
  }
  // ...
  @PostMapping(path = "/proxy_sleep")
  public Mono<Void> sleep(@RequestAttribute(name = "opentelemetry-context") Context context) {
    InvokeMethodRequest request = new InvokeMethodRequest(INVOKE_APP_ID, "sleep")
            .setHttpExtension(HttpExtension.POST);
    return client.invokeMethod(request, TypeRef.get(byte[].class)).subscriberContext(getReactorContext(context)).then();
  }
}
The request attribute opentelemetry-context is created by parsing the tracing headers in the OpenTelemetryInterceptor class. See the code below:
@Component
public class OpenTelemetryInterceptor implements HandlerInterceptor {
  // ...
  @Override
  public boolean preHandle(
      HttpServletRequest request, HttpServletResponse response, Object handler) {
    final TextMapPropagator textFormat = OpenTelemetry.getGlobalPropagators().getTextMapPropagator();
    // ...
    Context context = textFormat.extract(Context.current(), request, HTTP_SERVLET_REQUEST_GETTER);
    request.setAttribute("opentelemetry-context", context);
    return true;
  }
  // ...
}
Then, getReactorContext() method is used to convert the OpenTelemetry's context to Reactor's context in the OpenTelemetryConfig class:
@Configuration
@EnableAutoConfiguration(exclude = {DataSourceAutoConfiguration.class, HibernateJpaAutoConfiguration.class})
public class OpenTelemetryConfig {
  // ...
  public static reactor.util.context.Context getReactorContext(Context context) {
    Map<String, String> map = new HashMap<>();
    TextMapPropagator.Setter<Map<String, String>> setter =
        (carrier, key, value) -> map.put(key, value);

    GlobalOpenTelemetry.getPropagators().getTextMapPropagator().inject(context, map, setter);
    reactor.util.context.Context reactorContext = reactor.util.context.Context.empty();
    for (Map.Entry<String, String> entry : map.entrySet()) {
      reactorContext = reactorContext.put(entry.getKey(), entry.getValue());
    }
    return reactorContext;
  }
  // ...
}
Use the following command to execute the service:
dapr run --app-id tracingdemoproxy --app-port 3001 -- java -jar target/dapr-java-sdk-examples-exec.jar io.dapr.examples.tracing.TracingDemoService -p 3001This sample code uses the Dapr SDK for invoking two remote methods (proxy_echo and proxy_sleep). It is also instrumented with OpenTelemetry. See the code snippet below:
public class InvokeClient {

private static final String SERVICE_APP_ID = "tracingdemoproxy";
///...
  public static void main(String[] args) throws Exception {
    final OpenTelemetry openTelemetry = OpenTelemetryConfig.createOpenTelemetry();
    final Tracer tracer = openTelemetry.getTracer(InvokeClient.class.getCanonicalName());

    Span span = tracer.spanBuilder("Example's Main").setSpanKind(Span.Kind.CLIENT).startSpan();
    try (DaprClient client = (new DaprClientBuilder()).build()) {
      for (String message : args) {
        try (Scope scope = span.makeCurrent()) {
          InvokeMethodRequest request = new InvokeMethodRequest(SERVICE_APP_ID, "proxy_echo")
              .setBody(message)
              .setHttpExtension(HttpExtension.POST);
          client.invokeMethod(request, TypeRef.get(byte[].class))
            .map(r -> {
              System.out.println(new String(r));
              return r;
            })
            .flatMap(r -> {
              InvokeMethodRequest sleepRequest = new InvokeMethodRequest(SERVICE_APP_ID, "proxy_sleep")
                  .setHttpExtension(HttpExtension.POST);
              return client.invokeMethod(sleepRequest, TypeRef.get(Void.class));
            }).subscriberContext(getReactorContext()).block();
        }
      }
    }
    span.end();
    shutdown();
    System.out.println("Done");
  }
///...
}
The class knows the app id for the remote application. It uses the invokeMethod method to invoke API calls on the service endpoint. The request object includes an instance of io.opentelemetry.context.Context for the proper tracing headers to be propagated.
Execute the follow script in order to run the InvokeClient example, passing two messages for the remote method:
dapr run --app-id tracingdemoclient -- java -jar target/dapr-java-sdk-examples-exec.jar io.dapr.examples.tracing.InvokeClient "message one" "message two"Open the tracingdemo console and check the output as follows:
== APP == Server: "\"message one\"" @ 2021-03-10 22:10:23.598 and metadata: {"user-agent":"okhttp/4.9.0","host":"127.0.0.1:3000","content-type":"application/json; charset=utf-8","content-length":"17","connection":"Keep-Alive","x-daprrequestid":"00d801df-2773-4b9d-b389-12d0a93d6b90","accept-encoding":"gzip","x-forwarded-for":"192.168.1.15","x-forwarded-host":"X","forwarded":"for=192.168.1.15;by=192.168.1.15;host=X","traceparent":"00-4659182fd55c552b84fa291e3157d215-d0145c33df26c04d-01"}

== APP == Server: "\"message two\"" @ 2021-03-10 22:10:24.690 and metadata: {"user-agent":"okhttp/4.9.0","host":"127.0.0.1:3000","content-type":"application/json; charset=utf-8","content-length":"17","forwarded":"for=192.168.1.15;by=192.168.1.15;host=X","connection":"Keep-Alive","accept-encoding":"gzip","x-forwarded-host":"X","x-daprrequestid":"7ef1e4d5-fab5-4375-98cc-0268d22504f0","x-forwarded-for":"192.168.1.15","traceparent":"00-4659182fd55c552b84fa291e3157d215-92beb2b9df7e1450-01"}
Method have been remotely invoked and displaying the remote messages.
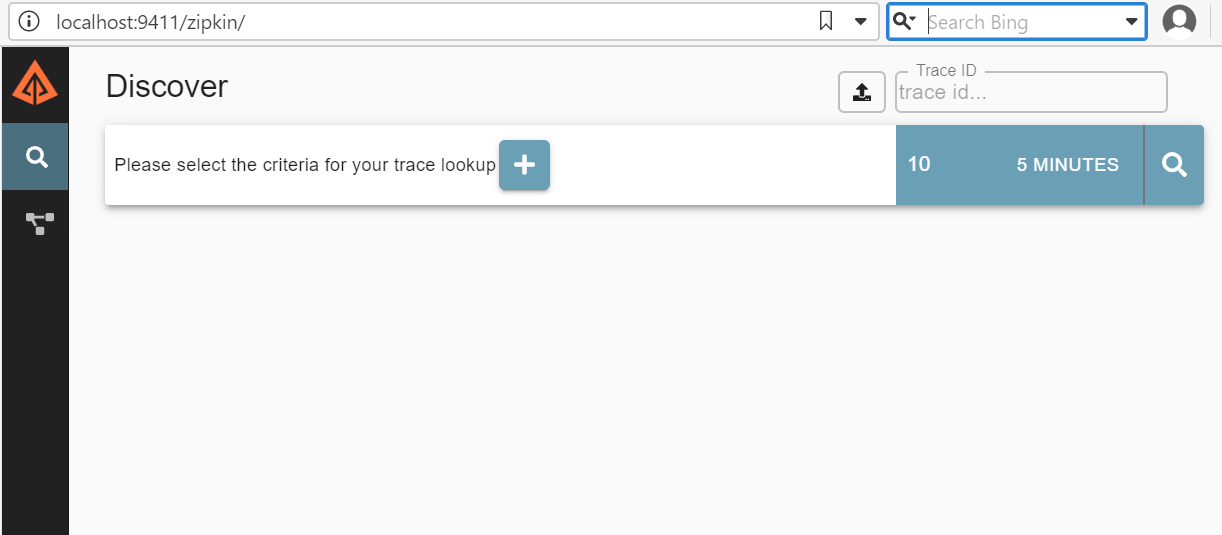
Now, open Zipkin on http://localhost:9411/zipkin. You should see a screen like the one below:
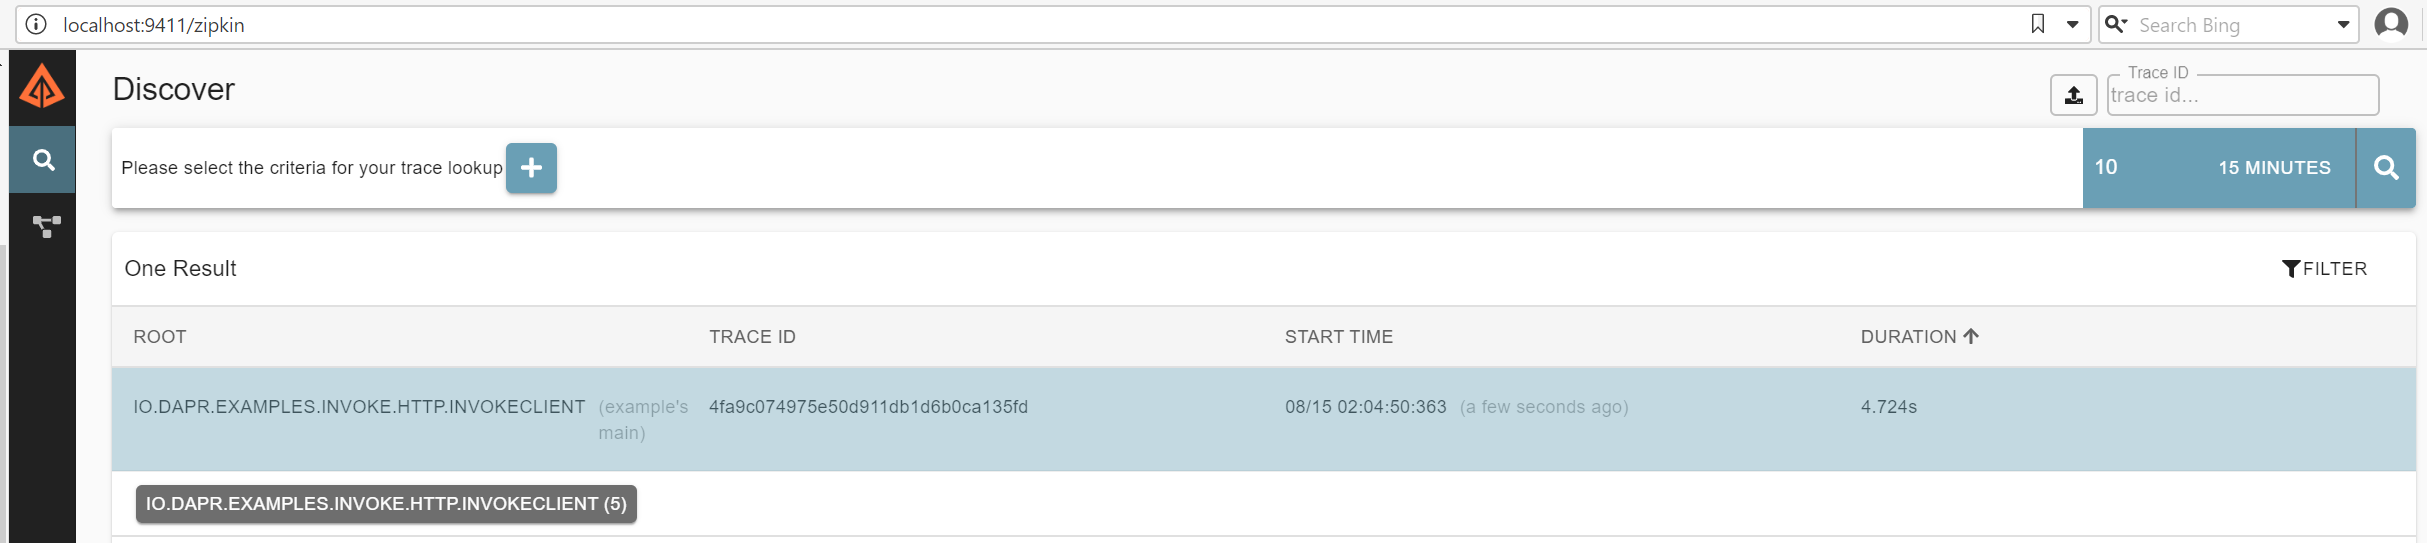
Click on the search icon to see the latest query results. You should see a tracing diagram similar to the one below:
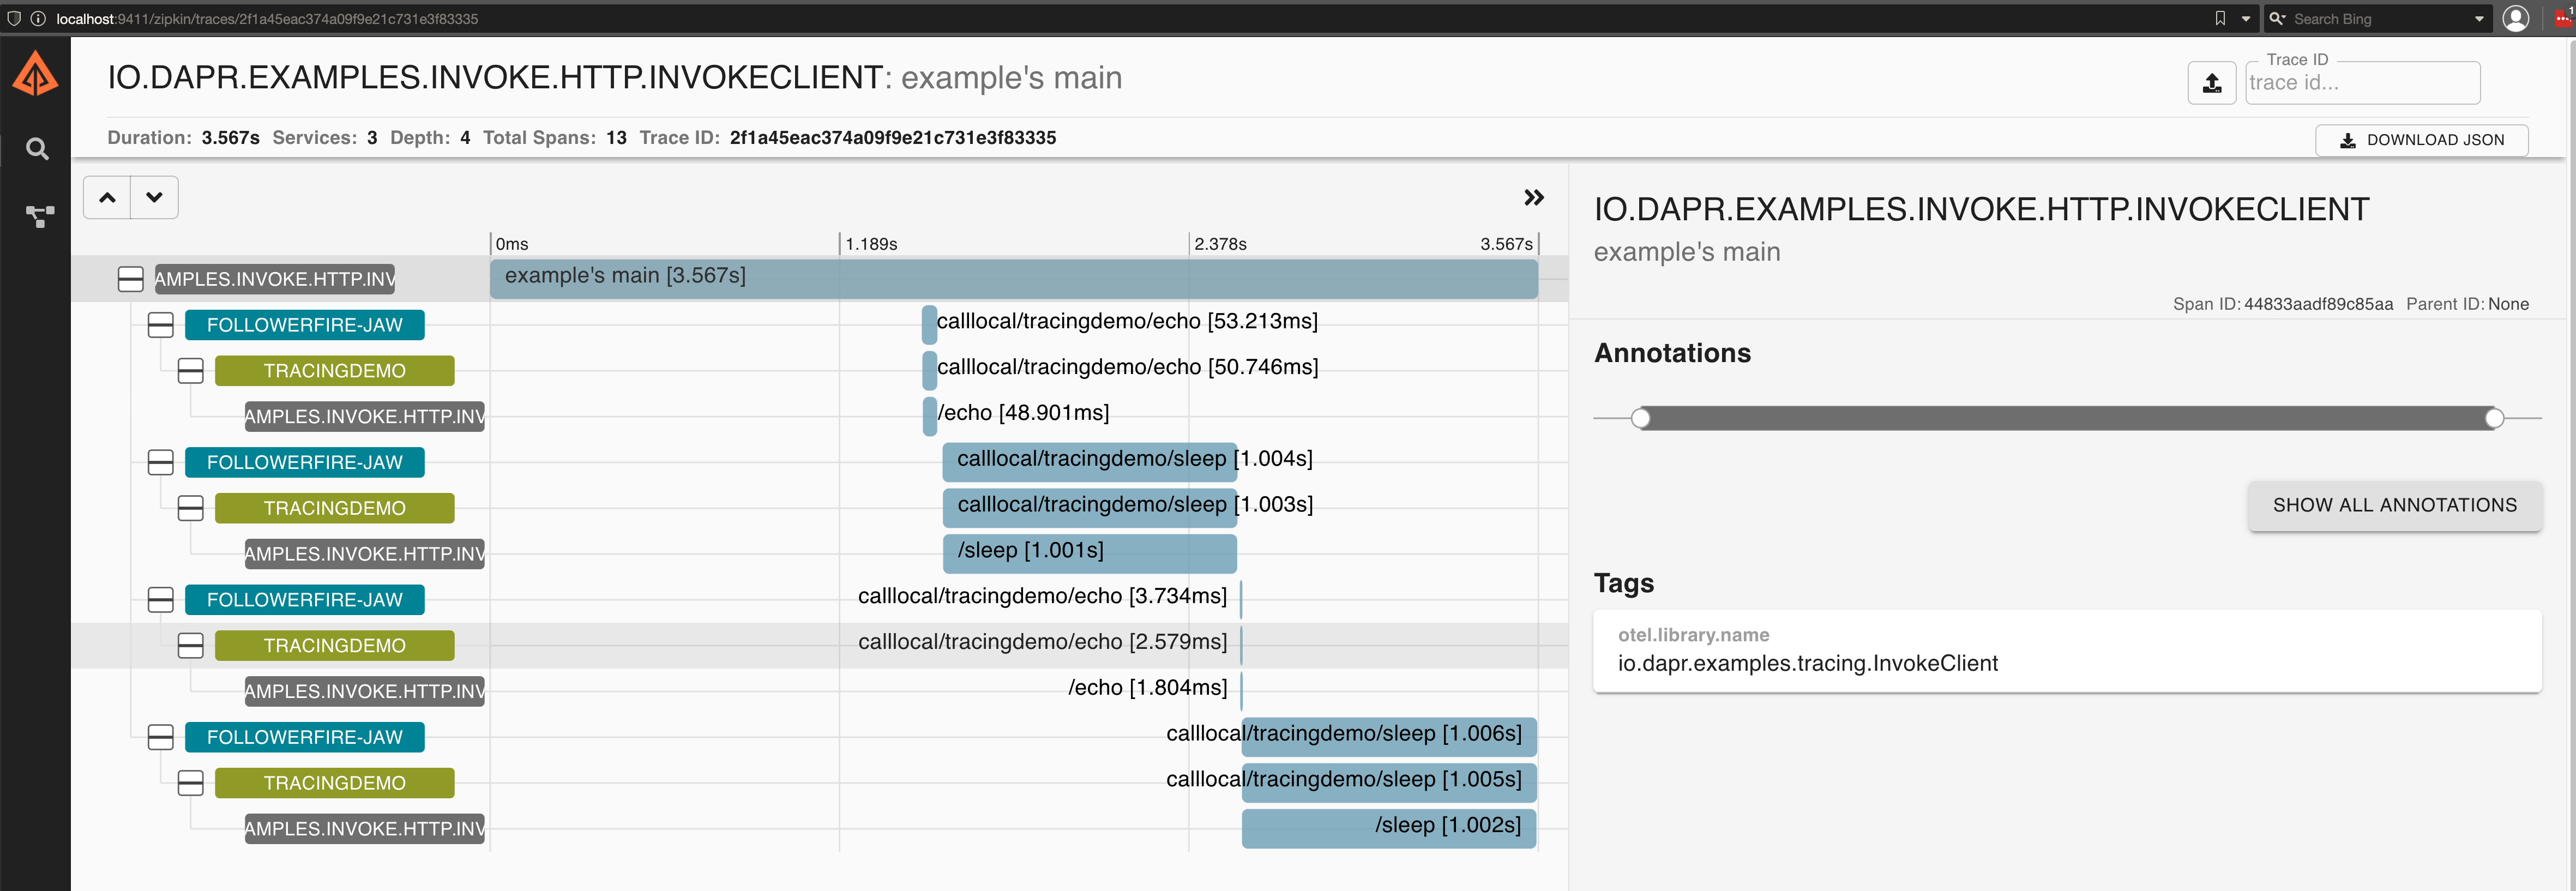
Once you click on the tracing event, you will see the details of the call stack starting in the client and then showing the service API calls right below.