New issue
Have a question about this project? Sign up for a free GitHub account to open an issue and contact its maintainers and the community.
By clicking “Sign up for GitHub”, you agree to our terms of service and privacy statement. We’ll occasionally send you account related emails.
Already on GitHub? Sign in to your account
Devtools: Allow saving and loading a profiler run as JSON #16744
Comments
This doesn't sound right. Reloading/refreshing a page does not erase previous profiling data.
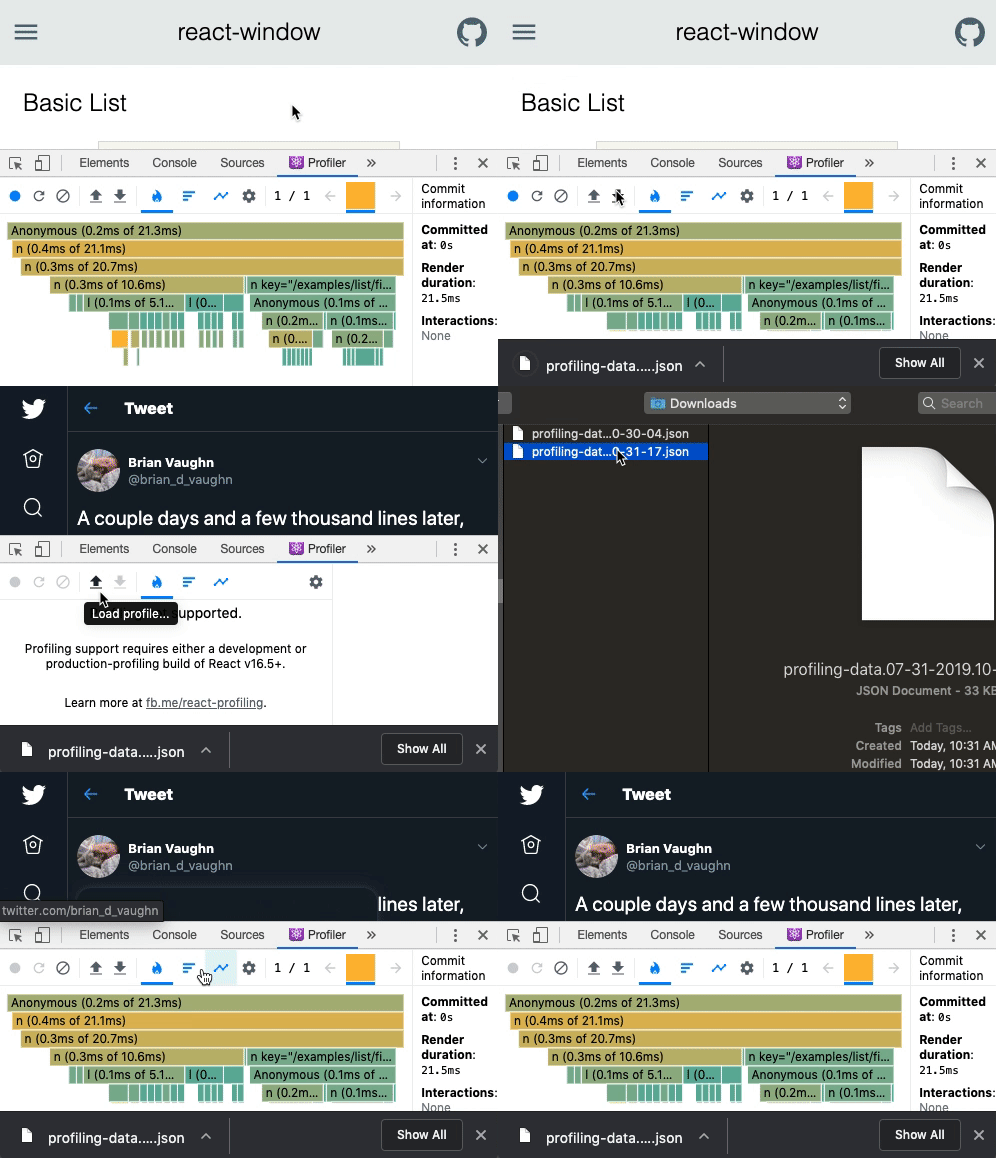
Importing and exporting Profiler data is already supported by DevTools. From the docs: Profiler data can now be exported and shared with other developers to enable easier collaboration. Exports include all commits, timings, interactions, etc.
This is not something we plan to add support for. The Profiler API is available for programmatic use though. |
|
Apologies for the confusion. I was using react-native-debugger. I thought it was using devtools v4 but it appears to still be v3. |
|
Could I propose re-opening this issue? I have an interesting use case I think this would be ideal for. I'm experimenting with using Puppeteer to do automated React performance analysis. The intent is to be able to run the script against any React site that has the profiler-build enabled. The idea of using Puppeteer is that we could then write automation scripts that script key interactions or workflows and then generate a performance analysis on-demand, probably using CI environments or locally on our machines. Basically, we want to automate the running of React Profiler for a battery of sites that are built using a standard site harness we provide (so we can always build them on-demand with the profiling-enabled React build). I have a little script that works like a charm except I can't get the Here is what I have so far: const puppeteer = require("puppeteer");
const fs = require("fs").promises;
const path = require("path");
const chalk = require("chalk");
const { prepareProfilingDataExport } = require("./react-devtools-utils");
(async () => {
const siteUrl = process.argv[2];
const pathToExtension = path.join(__dirname, "react-devtools-extension");
const browser = await puppeteer.launch({
ignoreHTTPSErrors: true,
headless: false,
devtools: true,
defaultViewport: {
width: 1440,
height: 768,
},
args: [
`--disable-extensions-except=${pathToExtension}`,
`--load-extension=${pathToExtension}`,
],
});
await browser.targets();
const page = await browser.newPage();
await page.goto(siteUrl);
// Wait for React Devtools to be hooked in
await page.waitForFunction(() => {
return !!window.__REACT_DEVTOOLS_GLOBAL_HOOK__.reactDevtoolsAgent;
});
// Reload and profile the page
await page.evaluate(() => {
window.__REACT_DEVTOOLS_GLOBAL_HOOK__.reactDevtoolsAgent.reloadAndProfile();
});
// Wait some amount of time
// TODO: In the future, this is where we could run user-defined Puppeteer scripts
// to analyze an interaction or workflow or whatever we want.
await page.waitFor(5000);
// Stop profiling
await page.evaluate(() => {
window.__REACT_DEVTOOLS_GLOBAL_HOOK__.reactDevtoolsAgent.stopProfiling();
});
// !!!
// This doesn't work as I'd like, due to the frontend vs. backend handling of data
// !!!
const profilingData = await page.evaluate(() => {
return window.__REACT_DEVTOOLS_GLOBAL_HOOK__.reactDevtoolsAgent.rendererInterfaces[1].getProfilingData();
});
const exportedData = prepareProfilingDataExport(profilingData);
//
//
const outputFile = `profiling-data-${new Date().getTime()}.json`;
await fs.writeFile(outputFile, JSON.stringify(exportedData, null, 2));
await browser.close();
console.log("Saved profiling output to:", chalk.green(outputFile));
})();Notably, the react-devtools-utils.js const PROFILER_EXPORT_VERSION = 4;
module.exports = {
/**
* https://github.com/facebook/react/blob/0836f62a5bd305d8f901e3b4645613e990f09d6e/packages/react-devtools-shared/src/devtools/views/Profiler/utils.js
*/
prepareProfilingDataExport: (profilingDataFrontend) => {
const dataForRoots = [];
profilingDataFrontend.dataForRoots.forEach(
({
commitData,
displayName,
initialTreeBaseDurations,
interactionCommits,
interactions,
operations,
rootID,
snapshots,
}) => {
dataForRoots.push({
commitData: commitData.map(
({
changeDescriptions,
duration,
fiberActualDurations,
fiberSelfDurations,
interactionIDs,
priorityLevel,
timestamp,
}) => ({
changeDescriptions:
changeDescriptions != null
? Array.from(changeDescriptions.entries())
: null,
duration,
fiberActualDurations: Array.from(fiberActualDurations.values()),
fiberSelfDurations: Array.from(fiberSelfDurations.values()),
interactionIDs,
priorityLevel,
timestamp,
})
),
displayName,
initialTreeBaseDurations: Array.from(
initialTreeBaseDurations.entries()
),
interactionCommits: Array.from(interactionCommits.entries()),
interactions: Array.from(interactions.entries()),
operations,
rootID,
snapshots: snapshots ? Array.from(snapshots.entries()) : [],
});
}
);
return {
version: PROFILER_EXPORT_VERSION,
dataForRoots,
};
},
};Of course, as I mentioned, At this point, I could look into manipulating the devtools Chrome panel itself using Puppeteer but I thought it would be worth putting this use case out there because with some additional APIs, I think this would be working like a champ. Something to the effect of: Would be all I would need to accomplish this I think. If there's another way you'd suggest, I'm all ears! |
What you're describing sounds pretty different from this issue. I don't think it would make sense to re-open this one. Feel free to file another one though, with the detail you've added above. No promises that we'll do the feature but it's fine to propose it 😄 |

Do you want to request a feature or report a bug?
Feature
What is the current behavior?
Currently, a profiler run is lost when reloading/refreshing the react app. This makes it hard to compare profiler runs across changes to the react code and use the profiler in CI/CD situations.
What is the expected behavior?
Be able to download a completed profiler run as json. Be able to upload a profiler run to react devtools for review later. Be able to trigger react devtools profiler programmatically. Be able to save a react devtools profiler run programmatically.
Which versions of React, and which browser / OS are affected by this issue? Did this work in previous versions of React?
React Devtools V4.
The text was updated successfully, but these errors were encountered: