Remove Calls to User Timing API #18417
Conversation
|
This pull request is automatically built and testable in CodeSandbox. To see build info of the built libraries, click here or the icon next to each commit SHA. Latest deployment of this branch, based on commit bf41bd2:
|
Details of bundled changes.Comparing: 5bd1bc2...bf41bd2 react-native-renderer
react-art
react-test-renderer
react-dom
react-reconciler
Size changes (stable) |
Details of bundled changes.Comparing: 5bd1bc2...bf41bd2 react-test-renderer
react-dom
react-art
react-native-renderer
react-reconciler
Size changes (experimental) |
| target._debugID = source._debugID; | ||
| target._debugIsCurrentlyTiming = source._debugIsCurrentlyTiming; | ||
| } | ||
| target._debugID = source._debugID; |
There was a problem hiding this comment.
This should be in an if (__DEV__) block, I think?
Actually I think the few lines below it should be as well.
There was a problem hiding this comment.
This whole function is DEV-only so I'm not sure this is necessary.
There was a problem hiding this comment.
I realize the function is named assignFiberPropertiesInDEV but it's not actually gated anywhere to be DEV only.
There was a problem hiding this comment.
It's gated at the usage site. But I agree it would make sense to wrap its body too.
There was a problem hiding this comment.
Yeah, we usually gate in both places I think.
Not new to this PR, just something I noticed while looking at the code changes.
|
Internal blocker removed in D20720332. |
|
tldr: this is unfortunate but if we're going to re-add this, we'll need to do it differently and probably only support very recent browsers (Level 3 spec). |
|
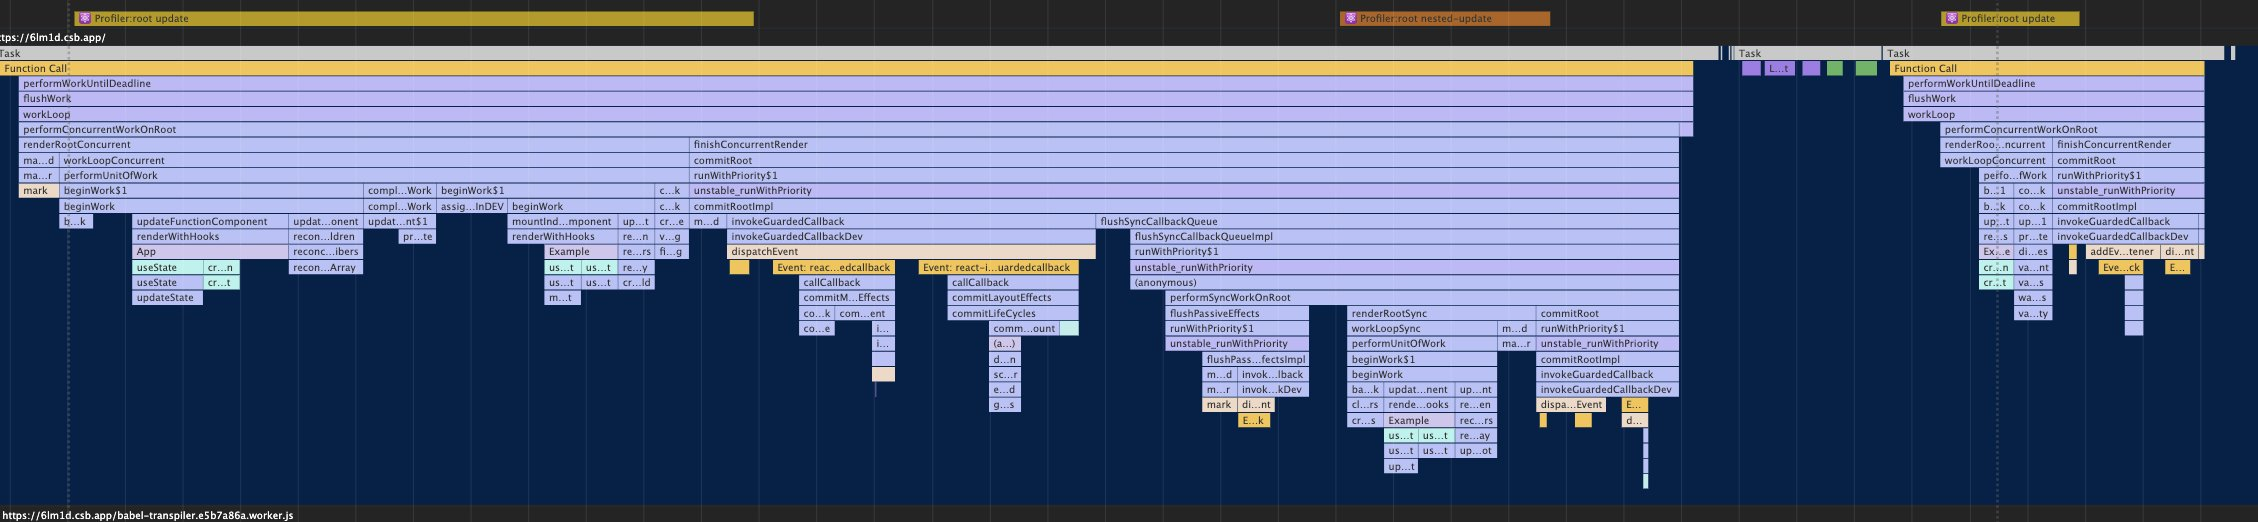
Hey, I know the ship has sailed for long on this, but I wanted to give a feedback on the removal of the user timing in the context of our project. These user timing markers were super useful inside the Firefox Profiler, because we could see them on the same interface than other information (especially javascript sampling with stacks), and we could clearly see that some component took a long time to render, with its children. Here are a few examples: So the exactness of the timings wasn't as important as having a general idea of what's going on, before digging further. I'm not so sure that using the standalone React Profiler is an improvement on that. Thanks |
|
Hey @julienw 👋
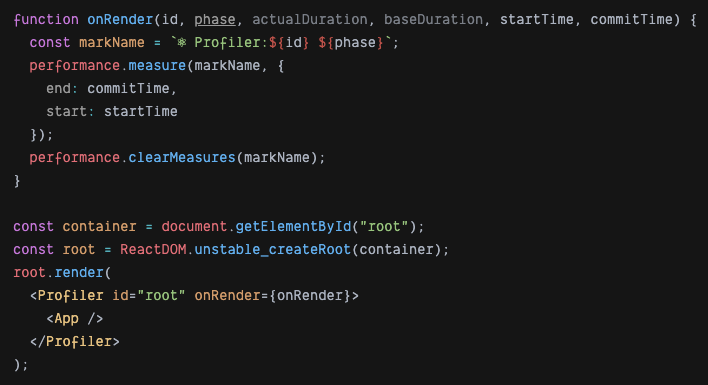
You can't recreate the user timing marks using
Can you elaborate on what pitfalls the React DevTools profiler has that makes it seem less useful to you? I'd love to learn more. Also I'm wondering if you've seen this side work we've been doing on a new profiling tool? It doesn't yet support parsing Firefox profiles, but that could be added 😁 Especially if we had a little help 😉 Would you (or someone else on your team) be interested in hopping on a video chat about this sometime? Might be useful for us to each have a better sense of what each other is working on and how we might be able to help each other. |
A quick note about this though: If you add selective
|
|
Thanks for the quick answer!
Ah, thanks for telling me this. I initially thought we could get all updates by using a top-level
While analyzing a profile, the first step is to focus on one interesting part. There are various ways to do this, but looking at the React markers is one common way when we work on a performance issue in a react application: we can double click on one of the markers, or select a group of markers, and only then move to another panel (probably the flame graph) to further analyze the performance issue. Being a standalone profiler, with the Devtools profiler we can't do this easy dance of using it to focus on one specific part of a profile. But I admit I haven't been using it for some weeks now, so I may have missed new stuff.
Ah ah I've seen it mentioned but didn't use it really yet :-)
I'll talk about that internally, I believe that would be useful indeed! Helping make React apps faster is a clear goal for us :-) |
This would give you aggregate statistics for all components within the Profiler's subtree, but it wouldn't be broken down by component like it is in the flamegraph.
Not sure if I understand the work flow you're describing, but it sounds like maybe you start by scanning some zoomed-out version of the flame graph and then focus in on any of the parts that looks slow and use the user timing markers to see if it's related to React? The React Profiler can help show you what the slowest part(s) of your app are from its perspective, but admittedly it misses some of the surrounding context (e.g. other JS and how slow it is relative, or even how much time is spent by React itself outside of your components). This is one of the reasons I would love to see us get more hooks into the native Performance panel 😄 Let me know if/when you or anyone else from Moz wants to chat about this stuff. I'm always happy to make the time. 😄 |
|
I was analyzing another problem today, and thought this could be another good example of how we were using the React Markers. With only the JS function names, everything is very generic. The React UserTiming markers were helping to understand what was going on. |
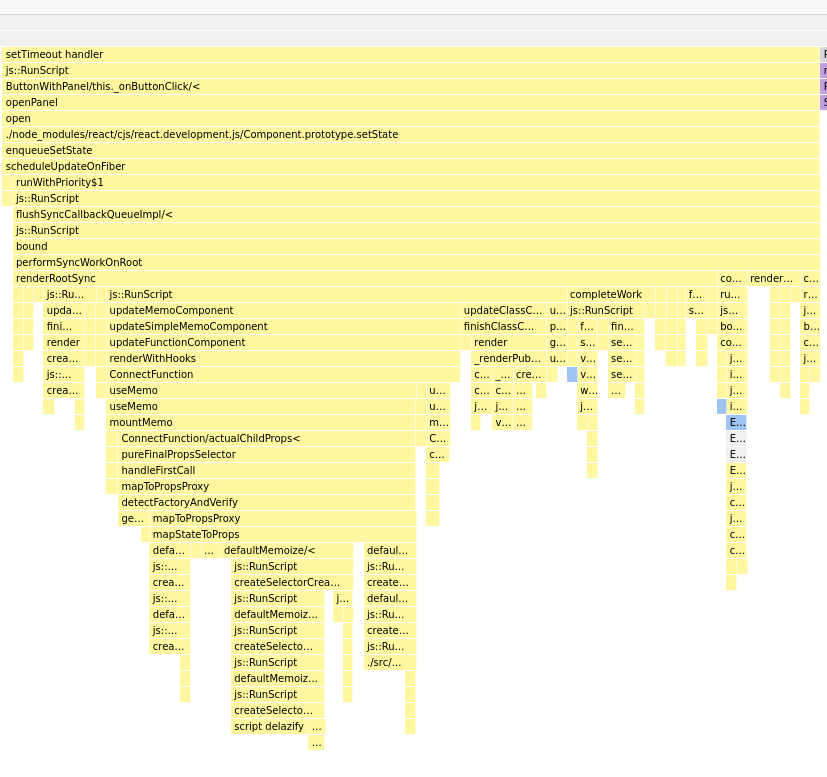
|
React's implementation doesn't match most people's mental models for how |
|
Hi, I recently upgraded to v17.0. I really miss this feature, I used it while also displaying a redux dispatched action. I found this very useful to identify issues with unnecessary or duplicate renders as I would get a nice overview of what action I dispatched and all the components that rendered under it. The inaccurate timings were not an issue for me as once I identified an area that needed some work I would use other tools to drill into the problem. Now I don't have a nice way to replicate this view. I can still see my dispatched timings and I can profile individual renders with the react profiler but I miss having a way to see what action caused a group of renders. Is there any other way to achieve this? |
|
@JPNZ4 No. There is no current alternative for the User Timing marks that used to be in React DEV builds. Typically we suggest using the React DevTools Profiler instead but for your use case that wouldn't really be relevant. We have some ongoing efforts on building a new profiling tool that would be similar to the user marks, which you can read about (and even beta test) here but I don't expect we'll release this in a more stable format for at least a few months because of competing priorities. |
|
Hello everyone, I feel soooo late on this, but after digging for days, I am glad I found this thread :) I don't know if it is the best place for this, but: User Timing API was not the best solution indeed, but allowed to access data programmatically. This is super powerful to optimize/supervise performance "in real condition" (ex: sampling random sessions, isolating slow renders, etc.) From my understanding, the DevTools now has some kind of direct access to React, which is difficult to reproduce from an external package, am I correct? Did anyone find an option to observe performance programmatically and "globally"? The options seem to be:
Really interesting topic! Thank you! |
|
Hello, I am facing the same problem currently. I would like to be able to observe performance of all my components programmically. Especially being able to track the rerenders of components that haven't changed (what printWasted() of the old Perf addon was able to do), get how many instances of a component there is, etc... |
|
I deep dived to reproduce ReactDevTools tracking mechanism but had to give up as it was really hard to follow unfortunately might give another shot later :) |
This removes calls to the User Timing API in development.
There are several reasons why we want to do this.
Inaccurate timings. When we originally added it, we didn't have any profiling tools with React-specific knowledge. So we used what we could. Unfortunately, User Timings API was originally designed for cases like "loading page", and not for marking thousands of components. So it adds a lot of overhead. We've seen cases in hot paths where the User Timing API calls themselves account for over 30% of the rendering time. This means the measurements are skewed and often misleading. And since you can only get them in DEV mode, they're even worse. To solve this, we introduced React Profiler and special profiling buidls that give you much more accurate timings over a year ago, and we recommend using it.
Insufficient programmatic API. While User Timings API offers a way to observe measures, this API isn't well-suited for React's use cases either. Both in the open source community and internally at Facebook we've seen very complicated code attempting to parse data out of the performance markers. These approaches are fragile because they have to parse metadata out of strings. As an alternative, we added the
<React.Profiler>component to gather measurements programmatically.Bugs and maintenance burden. Supporting this has created a significant maintenance burden. The way the User Timing API is designed doesn't match how React works so we have to jump through a lot of hoops to play nice with it. Our support for it is pretty buggy and those bugs are very hard to fix. This is impeding refactors that would let us improve React's memory usage and make it faster, for example. Now that we have better alternatives, the cost of this is prohibitive compared to the value it provides.
Isn't This a Breaking Change?
This is not a breaking change because this utility has always been DEV-only. It is not enabled even in the Profiling builds. We reserve the right to change DEV-only behavior between versions. In this case, making this change would likely make React faster in development at the cost of some annoyance (learning to use a different and more accurate tool). There are clearly downsides, like losing the ability to see different markers side by side. Maybe we can solve them in the longer term, as described in next section.
Can We Add Them Back?
I think we could, eventually. The last version of the standard addressed some of the pain points, including the ability to attach metadata and (seemingly) the ability to specify custom timestamps. That might allow us to remove a lot of implementation complexity. However, we would still need to rip out this implementation since the new one would be significantly different. Additionally, we still wouldn't feel comfortable adding this back until we're sure that the performance penalties in major browsers have been addressed. For example, in the past we've seen these bugs unsolved for years.
Blockers
We have some blockers at FB where we rely on these in production as an experiment. That was a bad idea. See D20720369 and D20720332 for possible paths forward. We'll need to resolve that before merging.