-
|
I want to visualize the image using cartopy. import ee
import geemap
import cartopy.crs as ccrs
# import the cartoee functionality from geemap
from geemap import cartoee
import matplotlib.pyplot as plt
fig = plt.figure(figsize=(10, 8))
# roi = ee.FeatureCollection("users/Molly_HK/daymet_area")
image = crossCorr.clip(roi)
vis = {
'min': -1,
'max': 1,
'palette': ['4AAAF7',"4AE7F7", 'D3D1CD',"FFB833",'FF5B33']
}
ax = cartoee.get_map(crossCorr, region=[-30.0, 0, -180.0, 90], vis_params=vis) #[E,S,W,N]
ax = cartoee.add_colorbar(ax, vis, loc="bottom", label="Correlation", orientation="horizontal")
plt.show() |
Beta Was this translation helpful? Give feedback.
Answered by
giswqs
May 6, 2024
Replies: 3 comments
-
|
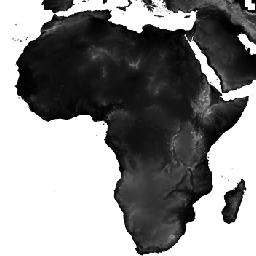
This is likely your own data problem. The following example works fine on Google Colab. import ee
import geemap
from geemap import cartoee
import matplotlib.pyplot as plt
geemap.ee_initialize()
# get an image
srtm = ee.Image("CGIAR/SRTM90_V4")
# geospatial region in format [E,S,W,N]
region = [180, -60, -180, 85] # define bounding box to request data
vis = {"min": 0, "max": 3000} # define visualization parameters for image
fig = plt.figure(figsize=(15, 10))
# use cartoee to get a map
ax = cartoee.get_map(srtm, region=region, vis_params=vis)
# add a colorbar to the map using the visualization params we passed to the map
cartoee.add_colorbar(ax, vis, loc="bottom", label="Elevation", orientation="horizontal")
# add gridlines to the map at a specified interval
cartoee.add_gridlines(ax, interval=[60, 30], linestyle=":")
# add coastlines using the cartopy api
ax.coastlines(color="red")
plt.show()
|

Beta Was this translation helpful? Give feedback.
0 replies
Answer selected by
giswqs
-
|
Dear prof Wu,
The data information are as follows: {'type': 'Image', 'bands': [{'id': 'Corr', 'data_type': {'type': 'PixelType', 'precision': 'double'}, 'dimensions': [70165, 19733], 'origin': [7393, 1489], 'crs': 'SR-ORG:6974', 'crs_transform': [463.3127165279165, 0, -20015109.354, 0, -463.3127165279167, 10007554.677003]}]}
The example image information as follow: {'type': 'Image', 'bands': [{'id': 'elevation', 'data_type': {'type': 'PixelType', 'precision': 'int', 'min': -32768, 'max': 32767}, 'dimensions': [432000, 144000], 'crs': 'EPSG:4326', 'crs_transform': [0.000833333333333, 0, -180, 0, -0.000833333333333, 60]}], 'version': 1641990053291277, 'id': 'CGIAR/SRTM90_V4', 'properties': {'system:visualization_0_min': '-100.0', 'type_name': 'Image', 'keywords': ['cgiar', 'dem', 'elevation', 'geophysical', 'srtm', 'topography'], 'thumb': 'https://mw1.google.com/ges/dd/images/SRTM90_V4_thumb.png', 'description': '<p>The Shuttle Radar Topography Mission (SRTM) digital\nelevation dataset was originally produced to provide consistent,\nhigh-quality elevation data at near global scope. This version\nof the SRTM digital elevation data has been processed to fill data\nvoids, and to facilitate its ease of use.</p><p><b>Provider: <a href="https://srtm.csi.cgiar.org/">NASA/CGIAR</a></b><br><p><b>Bands</b><table class="eecat"><tr><th scope="col">Name</th><th scope="col">Description</th></tr><tr><td>elevation</td><td><p>Elevation</p></td></tr></table><p><b>Terms of Use</b><br><p>DISTRIBUTION. Users are prohibited from any commercial, non-free resale, or\nredistribution without explicit written permission from CIAT. Users should\nacknowledge CIAT as the source used in the creation of any reports,\npublications, new datasets, derived products, or services resulting from the\nuse of this dataset. CIAT also request reprints of any publications and\nnotification of any redistributing efforts. For commercial access to\nthe data, send requests to <a ***@***.***">Andy Jarvis</a>.</p><p>NO WARRANTY OR LIABILITY. CIAT provides these data without any warranty of\nany kind whatsoever, either express or implied, including warranties of\nmerchantability and fitness for a particular purpose. CIAT shall not be\nliable for incidental, consequential, or special damages arising out of\nthe use of any data.</p><p>ACKNOWLEDGMENT AND CITATION. Any users are kindly asked to cite this data\nin any published material produced using this data, and if possible link\nweb pages to the <a href="https://srtm.csi.cgiar.org">CIAT-CSI SRTM website</a>.</p><p><b>Suggested citation(s)</b><ul><li><p>Jarvis, A., H.I. Reuter, A. Nelson, E. Guevara. 2008. Hole-filled\nSRTM for the globe Version 4, available from the CGIAR-CSI SRTM\n90m Database: https://srtm.csi.cgiar.org.</p></li></ul><style>\n table.eecat {\n border: 1px solid black;\n border-collapse: collapse;\n font-size: 13px;\n }\n table.eecat td, tr, th {\n text-align: left; vertical-align: top;\n border: 1px solid gray; padding: 3px;\n }\n td.nobreak { white-space: nowrap; }\n</style>', 'source_tags': ['cgiar'], 'visualization_0_max': '8000.0', 'title': 'SRTM Digital Elevation Data Version 4', 'product_tags': ['srtm', 'elevation', 'topography', 'dem', 'geophysical'], 'provider': 'NASA/CGIAR', 'visualization_0_min': '-100.0', 'visualization_0_name': 'Elevation', 'date_range': [950227200000, 951177600000], 'system:visualization_0_gamma': 1.6, 'period': 0, 'system:visualization_0_bands': 'elevation', 'system:time_end': 951177600000, 'provider_url': 'https://srtm.csi.cgiar.org/', 'sample': 'https://mw1.google.com/ges/dd/images/SRTM90_V4_sample.png', 'tags': ['cgiar', 'dem', 'elevation', 'geophysical', 'srtm', 'topography'], 'system:time_start': 950227200000, 'system:visualization_0_max': '8000.0', 'system:visualization_0_name': 'Elevation', 'system:asset_size': 18827626666, 'visualization_0_bands': 'elevation'}}
It seems that my image no problem. But I don't know why it can not display in cartopy.
My image also can show in the geemap.
In the cartopy:
Thanks for your time. I look forward to your response.
Best regards,
Mengying CAO
…------------------ Original ------------------
From: ***@***.***>;
Date: Mon, May 6, 2024 09:02 PM
To: ***@***.***>;
Cc: ***@***.***>; ***@***.***>;
Subject: Re: [gee-community/geemap] error in display the image by cartopy (Discussion #2005)
This is likely your own data problem. The following example works fine on Google Colab.
import ee
import geemap
from geemap import cartoee
import matplotlib.pyplot as plt

geemap.ee_initialize()

# get an image
srtm = ee.Image("CGIAR/SRTM90_V4")

# geospatial region in format [E,S,W,N]
region = [180, -60, -180, 85]  # define bounding box to request data
vis = {"min": 0, "max": 3000}  # define visualization parameters for image

fig = plt.figure(figsize=(15, 10))

# use cartoee to get a map
ax = cartoee.get_map(srtm, region=region, vis_params=vis)

# add a colorbar to the map using the visualization params we passed to the map
cartoee.add_colorbar(ax, vis, loc="bottom", label="Elevation", orientation="horizontal")

# add gridlines to the map at a specified interval
cartoee.add_gridlines(ax, interval=[60, 30], linestyle=":")

# add coastlines using the cartopy api
ax.coastlines(color="red")

plt.show()
image.png (view on web)
—
Reply to this email directly, view it on GitHub, or unsubscribe.
You are receiving this because you authored the thread.Message ID: ***@***.***>
|
Beta Was this translation helpful? Give feedback.
0 replies
-
|
The whole coding shows as follows:
1) calculate
import datetime
import ee
import geemap
Map = geemap.Map()
import numpy as np
import matplotlib.pyplot as plt
year = 2010
startDate = str(year) +'-01-01'
endDate = str(year) +'-12-31'
roi = ee.FeatureCollection("users/Molly_HK/daymet_area")
dataset = ee.ImageCollection('MODIS/061/MCD12Q2').filterBounds(roi).filter(ee.Filter.date(startDate, endDate));
sos = dataset.select('Greenup_1').first().clip(roi);
eos = dataset.select('Dormancy_1').first().clip(roi);
print(sos.getInfo())
init = datetime.date(1970,1,1)
print(init)
MODIS_date = datetime.date(year-1,12,31)
print(MODIS_date)
init_day = (MODIS_date - init).days
# print(init_day)
sos_doy = sos.subtract(init_day).rename("SOS")
eos_doy = eos.subtract(init_day).rename("EOS")
gls_doy = eos.subtract(sos).rename("GLS")
daymet= ee.ImageCollection('NASA/ORNL/DAYMET_V4').filter(ee.Filter.date(startDate, endDate));
tmax = daymet.select('tmax').first().clip(roi);
# print(sos_doy.getInfo())
# print(tmax.getInfo())
# raster1 = sos_doy
raster1 = eos_doy
raster2 = tmax
# // Define the window size for the cross-correlation
winSize = 5;
# Compute the mean of the two rasters
mean1 = raster1.reduceNeighborhood(
reducer=ee.Reducer.mean(),
kernel=ee.Kernel.square(winSize)
)
mean2 = raster2.reduceNeighborhood(
reducer=ee.Reducer.mean(),
kernel=ee.Kernel.square(winSize)
)
# Compute the standard deviation of the two rasters
std1 = raster1.reduceNeighborhood(
reducer=ee.Reducer.stdDev(),
kernel=ee.Kernel.square(winSize)
)
std2 = raster2.reduceNeighborhood(
reducer=ee.Reducer.stdDev(),
kernel=ee.Kernel.square(winSize)
)
# Compute the cross-correlation
crossCorr = raster1.subtract(mean1).multiply(raster2.subtract(mean2)).reduceNeighborhood(reducer=ee.Reducer.mean(),kernel=ee.Kernel.square(winSize)).divide(std1).divide(std2).rename("Corr")
print(crossCorr.getInfo())
# Set visualization parameters
vis_params = {
'min': -1,
'max': 1,
# "palette": ['blue','green','Yellow','red']
"palette": ['3CCDC8',"3CCD99", 'D3D1CD',"FFB833",'FF5B33']
}
# Convert the cross-correlation image to a numpy array
# crossCorr_array = crossCorr.toArray().getInfo()
# print(crossCorr_array.getInfo())
Map = geemap.Map()
Map.addLayer(crossCorr, vis_params, 'Cross-correlation')
Map.addLayerControl()
Map.add_colorbar(vis_params,label="correlation")
Map
2) show image:
import ee
import geemap
from geemap import cartoee
import cartopy.crs as ccrs
fig = plt.figure(figsize=(5,4))
roi = ee.FeatureCollection("users/Molly_HK/daymet_area")
image = crossCorr.clip(roi)
# image = raster1.clip(roi)
vis = {
'min': -1,
'max': 1,
"palette": ['4AAAF7',"4AE7F7", 'D3D1CD',"FFB833",'FF5B33']
}
print(image.getInfo())
ax = cartoee.get_map(image, region=[-30.0, 0, -180.0, 90], vis_params=vis) #[E,S,W,N]
cartoee.add_colorbar(ax, vis, loc="bottom", label="Correlation", orientation="horizontal")
plt.show()
…------------------ Original ------------------
From: ***@***.***>;
Date: Mon, May 6, 2024 09:02 PM
To: ***@***.***>;
Cc: ***@***.***>; ***@***.***>;
Subject: Re: [gee-community/geemap] error in display the image by cartopy (Discussion #2005)
This is likely your own data problem. The following example works fine on Google Colab.
import ee import geemap from geemap import cartoee import matplotlib.pyplot as plt geemap.ee_initialize() # get an image srtm = ee.Image("CGIAR/SRTM90_V4") # geospatial region in format [E,S,W,N] region = [180, -60, -180, 85] # define bounding box to request data vis = {"min": 0, "max": 3000} # define visualization parameters for image fig = plt.figure(figsize=(15, 10)) # use cartoee to get a map ax = cartoee.get_map(srtm, region=region, vis_params=vis) # add a colorbar to the map using the visualization params we passed to the map cartoee.add_colorbar(ax, vis, loc="bottom", label="Elevation", orientation="horizontal") # add gridlines to the map at a specified interval cartoee.add_gridlines(ax, interval=[60, 30], linestyle=":") # add coastlines using the cartopy api ax.coastlines(color="red") plt.show()
image.png (view on web)
—
Reply to this email directly, view it on GitHub, or unsubscribe.
You are receiving this because you authored the thread.Message ID: ***@***.***>
|
Beta Was this translation helpful? Give feedback.
0 replies
Sign up for free
to join this conversation on GitHub.
Already have an account?
Sign in to comment
This is likely your own data problem. The following example works fine on Google Colab.