Grafana crashes when attempting to perform filter on json path #285
Comments
|
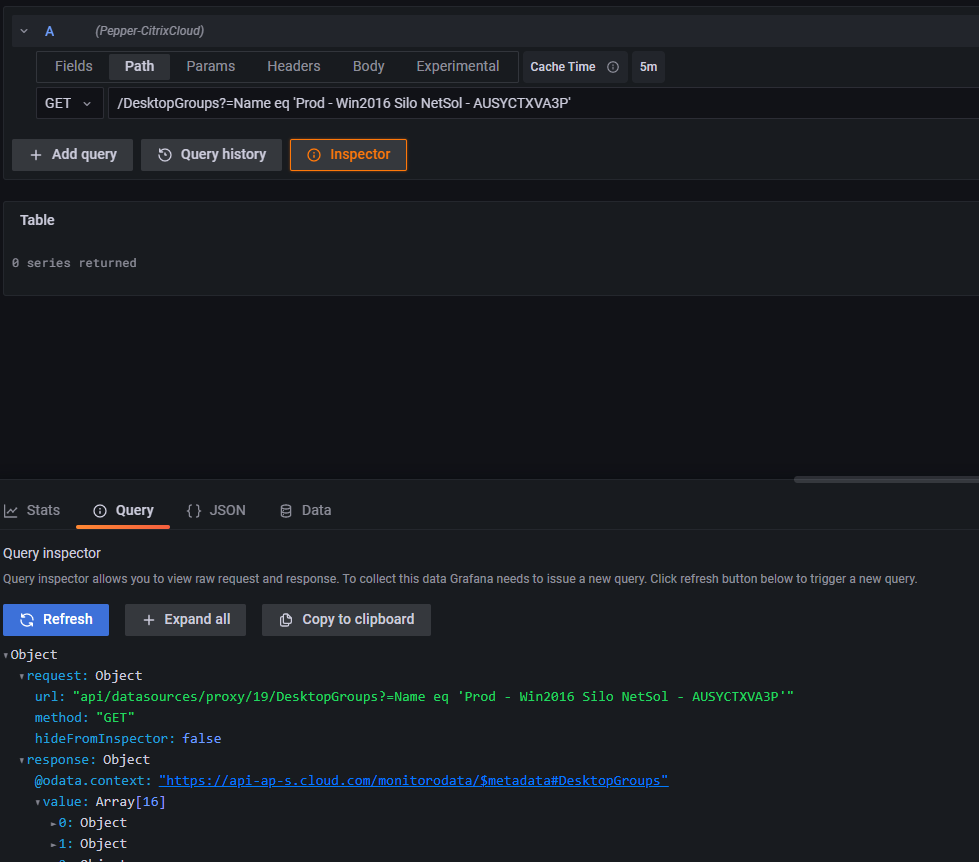
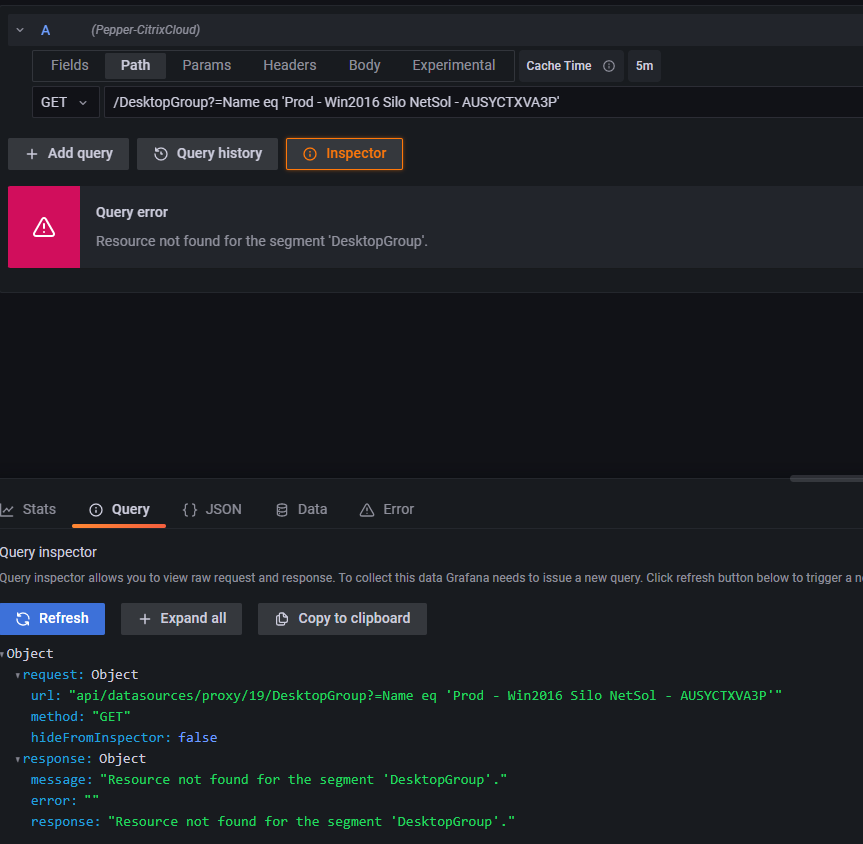
I just tested and Explorer only crashes when the $ was being introduced, not when the URL construct is incorrect. As per the below screenshot, the filter is not being introduced, that section is completely ignored and still returns valid data, Here is the expansion of one of the objects showing that the filter is not introduced as we are not calling it Here is an example of if the URL is incorrect and data doesn’t get returned. I don’t think that is exactly happening here because if the plugin was thinking it was a variable, I would imagine this would occur in all areas of the product rather than just under the Explore context.
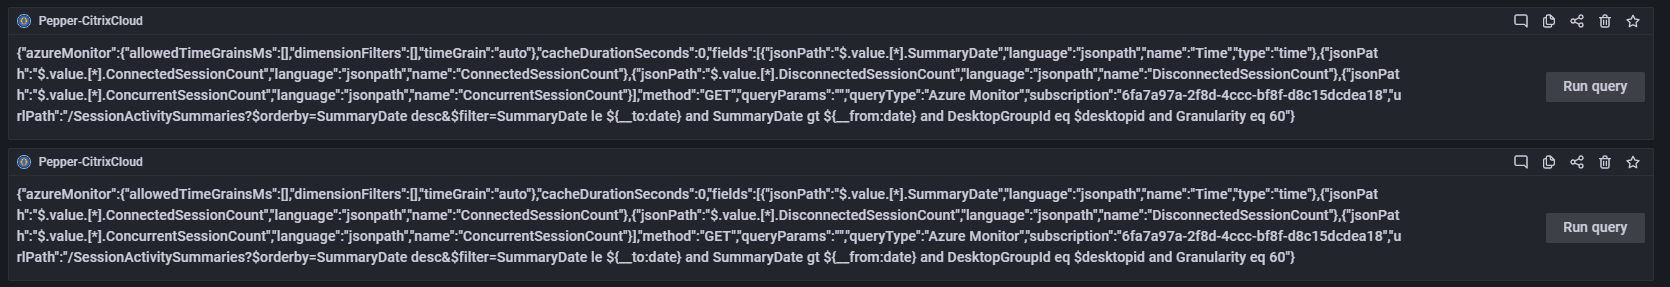
On further inspection as well, I noticed a strange even occurring when viewing the query history. As to why $orderby was working and it appears to be something relating to the data source occurring. As you can see below, my query now works when running from query history As you can see, it has introduced the azureMonitor data source for some reason? Here are some of my queries I was running a while ago (still after the 13/6) as well, I think these are from when I use the explore option for the panel. Here are the queries on the 13/6 or before where I believe the issue was first occurring which seems to be resolved now as when I run the query from history, it works as expected. |


|
Have you tried adding your filter to the params instead of directly in the path |
What happened?
Grafana crashes when attempting to use
?$filteron the JSON API pathThis occurs even when I’m not using the dashboard variable outside of the dashboard
When using Azure Monitor to perform the same, it Grafana converts the variable into the correct data for the Explorer view, how come doesn’t occur during this method?
What I’m seeing occur is as soon as I include the $ simple into my queries in Explore, Grafana breaks.
What was expected to happen?
Allow me to filter as part of the API request
Steps to reproduce the problem:
What is working?
Added
?What is not working?
Added
$As I’m trying to use
$filterwhich works within the Dashboard and variable queries, it’s in Explore where it breaks. Even if I copy/DesktopGroups?$filter=Name eq ‘Prod - Win2016 Silo NetSol - AUSYCTXVA3P, which the qualified query for one of my variables, Explore still crashes.Version numbers:
Grafana
9.0.2JSON API -
1.3.1The text was updated successfully, but these errors were encountered: