This guide walks you through the setup and configuration process for a tracing backend (in this case Zipkin, but Jaeger is simple to use as well), a metrics backend like Prometheus, and auto-instrumentation of NodeJS. You can find the guide for TypeScript here.
- Getting started with OpenTelemetry JS
This guide assumes you're using Zipkin as your tracing backend, but modifying it for Jaeger should be straightforward.
You can find an example application to use with this guide in the example directory. See what it looks like with tracing enabled in the traced-example directory.
The first thing you need before you can start collecting traces is a tracing backend like Zipkin that you can export traces to. If you already have a supported tracing backend (Zipkin or Jaeger), you can skip this step. If not, you need to run one.
To set up Zipkin as quickly as possible, run the latest Docker Zipkin container, exposing port 9411. If you can’t run Docker containers, you need to download and run Zipkin by following the Zipkin quickstart guide.
docker run --rm -d -p 9411:9411 --name zipkin openzipkin/zipkinBrowse to http://localhost:9411 to make sure you can see the Zipkin UI.
This guide uses the example application provided in the example directory, but the steps to instrument your own application should be broadly the same. Here's an overview of what you'll be doing:
- Install the required OpenTelemetry libraries
- Initialize a global tracer
- Initialize and register a trace exporter
To create traces on NodeJS, you need @opentelemetry/sdk-trace-node, @opentelemetry/core, and any instrumentation required by your application such as gRPC or HTTP. If you're using the example application, you need to install @opentelemetry/instrumentation-http and @opentelemetry/instrumentation-express.
$ npm install \
  @opentelemetry/api \
  @opentelemetry/sdk-trace-node \
  @opentelemetry/instrumentation-http \
  @opentelemetry/instrumentation-express \
@opentelemetry/instrumentation-grpcAll tracing initialization should happen before your application code runs. The easiest way to do this is to initialize tracing in a separate file that is required using the node -r option before your application code runs.
Create a file named tracing.js and add the following code:
'use strict';

const { diag, DiagConsoleLogger, DiagLogLevel } = require("@opentelemetry/api");
const { NodeTracerProvider } = require("@opentelemetry/sdk-trace-node");
const { registerInstrumentations } = require("@opentelemetry/instrumentation");
const { HttpInstrumentation } = require("@opentelemetry/instrumentation-http");
const { GrpcInstrumentation } = require("@opentelemetry/instrumentation-grpc");

const provider = new NodeTracerProvider();

diag.setLogger(new DiagConsoleLogger(), DiagLogLevel.ALL);

provider.register();

registerInstrumentations({
  instrumentations: [
    new HttpInstrumentation(),
    new GrpcInstrumentation(),
  ],
});
Now, if you run your application with node -r ./tracing.js app.js, your application will create and propagate traces over HTTP. If an already instrumented service that supports Trace Context headers calls your application using HTTP, and you call another application using HTTP, the Trace Context headers will be correctly propagated.
However, if you want to see a completed trace, you need to register an exporter to send traces to a tracing backend.
This guide uses the Zipkin tracing backend. However, if you're using another backend like Jaeger, make your change there.
To export traces, you need a few more dependencies. Install them with the following command:
$ npm install \
  @opentelemetry/sdk-trace-base \
  @opentelemetry/exporter-zipkin

$ # for jaeger you would run this command:
$ # npm install @opentelemetry/exporter-jaeger
After you install these dependencies, initialize and register them. Modify tracing.js so it matches the following code snippet. Optionally replace the service name "getting-started" with your own service name:
'use strict';

const { diag, DiagConsoleLogger, DiagLogLevel } = require("@opentelemetry/api");
const { NodeTracerProvider } = require("@opentelemetry/sdk-trace-node");
const { Resource } = require('@opentelemetry/resources');
const { SemanticResourceAttributes } = require('@opentelemetry/semantic-conventions');
const { SimpleSpanProcessor } = require("@opentelemetry/sdk-trace-base");
const { ZipkinExporter } = require("@opentelemetry/exporter-zipkin");
const { registerInstrumentations } = require("@opentelemetry/instrumentation");
const { HttpInstrumentation } = require("@opentelemetry/instrumentation-http");
const { GrpcInstrumentation } = require("@opentelemetry/instrumentation-grpc");

const provider = new NodeTracerProvider({
  resource: new Resource({
    [SemanticResourceAttributes.SERVICE_NAME]: "getting-started",
  })
});

diag.setLogger(new DiagConsoleLogger(), DiagLogLevel.ALL);

provider.addSpanProcessor(
  new SimpleSpanProcessor(
    new ZipkinExporter({
      // If you are running your tracing backend on another host,
      // you can point to it using the `url` parameter of the
      // exporter config.
    })
  )
);

provider.register();

registerInstrumentations({
  instrumentations: [
    new HttpInstrumentation(),
    new GrpcInstrumentation(),
  ],
});

console.log("tracing initialized");
Now if you run your application with the tracing.js file loaded, and you send requests to your application over HTTP (in the sample application just browse to http://localhost:8080), you'll see traces exported to your tracing backend that look like this:
node -r ./tracing.js app.js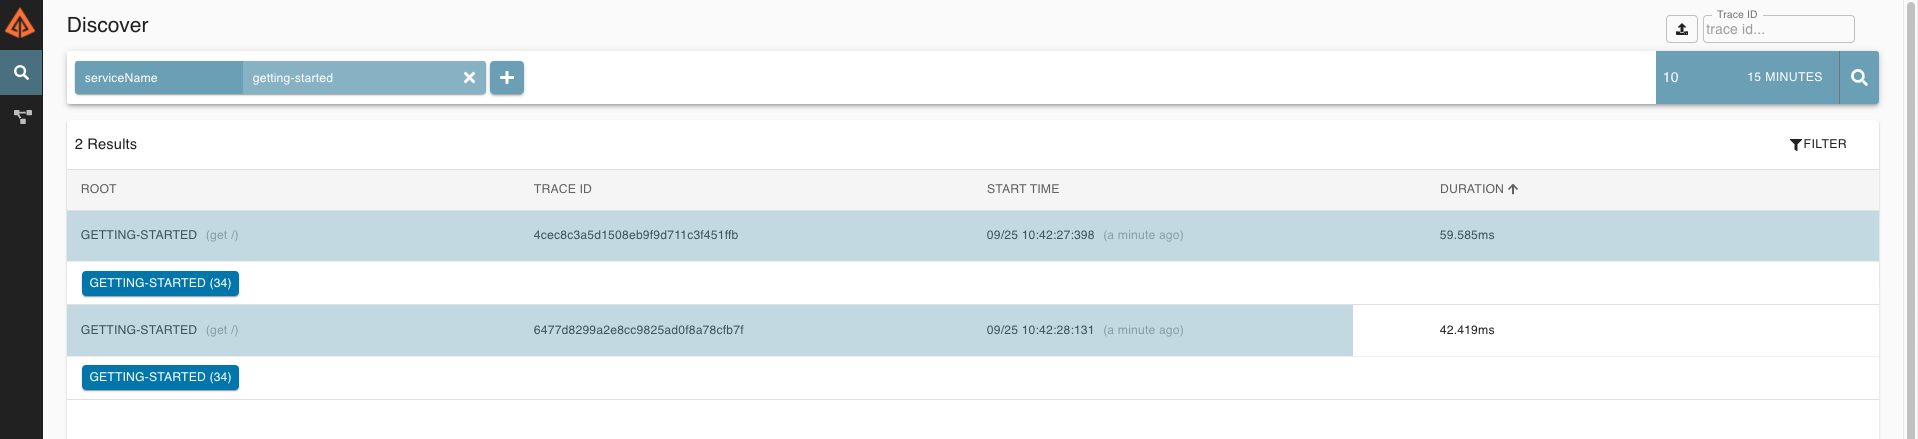
Note: Some spans appear to be duplicated, but they're not. This is because the sample application is both the client and the server for these requests. You see one span which is the client-side request timing, and one span which is the server side request timing. Anywhere they don’t overlap is network time.
This guide assumes you're using Prometheus as your metrics backend. It's currently the only metrics backend supported by OpenTelemetry JS.
Note: This section is a work in progress.
Now that you have end-to-end traces, you can collect and export some basic metrics.
Currently, the only supported metrics backend is Prometheus. Go to the Prometheus download page and download the latest release of Prometheus for your operating system.
Open a command line and cd into the directory where you downloaded the Prometheus tarball. Untar it into the newly created directory.
$ cd Downloads

$ # Replace the file name below with your downloaded tarball
$ tar xvfz prometheus-2.20.1.darwin-amd64.tar

$ # Replace the dir below with your created directory
$ cd prometheus-2.20.1.darwin-amd64

$ ls
LICENSE           console_libraries data              prometheus.yml    tsdb
NOTICE            consoles          prometheus        promtool
The created directory should have a file named prometheus.yml. This is the file used to configure Prometheus. For now, just make sure Prometheus starts by running the ./prometheus binary in the folder and browse to http://localhost:9090.
$ ./prometheus
# some output elided for brevity
msg="Starting Prometheus" version="(version=2.14.0, branch=HEAD, revision=edeb7a44cbf745f1d8be4ea6f215e79e651bfe19)"
# some output elided for brevity
level=info ts=2019-11-21T20:39:40.262Z caller=web.go:496 component=web msg="Start listening for connections" address=0.0.0.0:9090
# some output elided for brevity
level=info ts=2019-11-21T20:39:40.383Z caller=main.go:626 msg="Server is ready to receive web requests."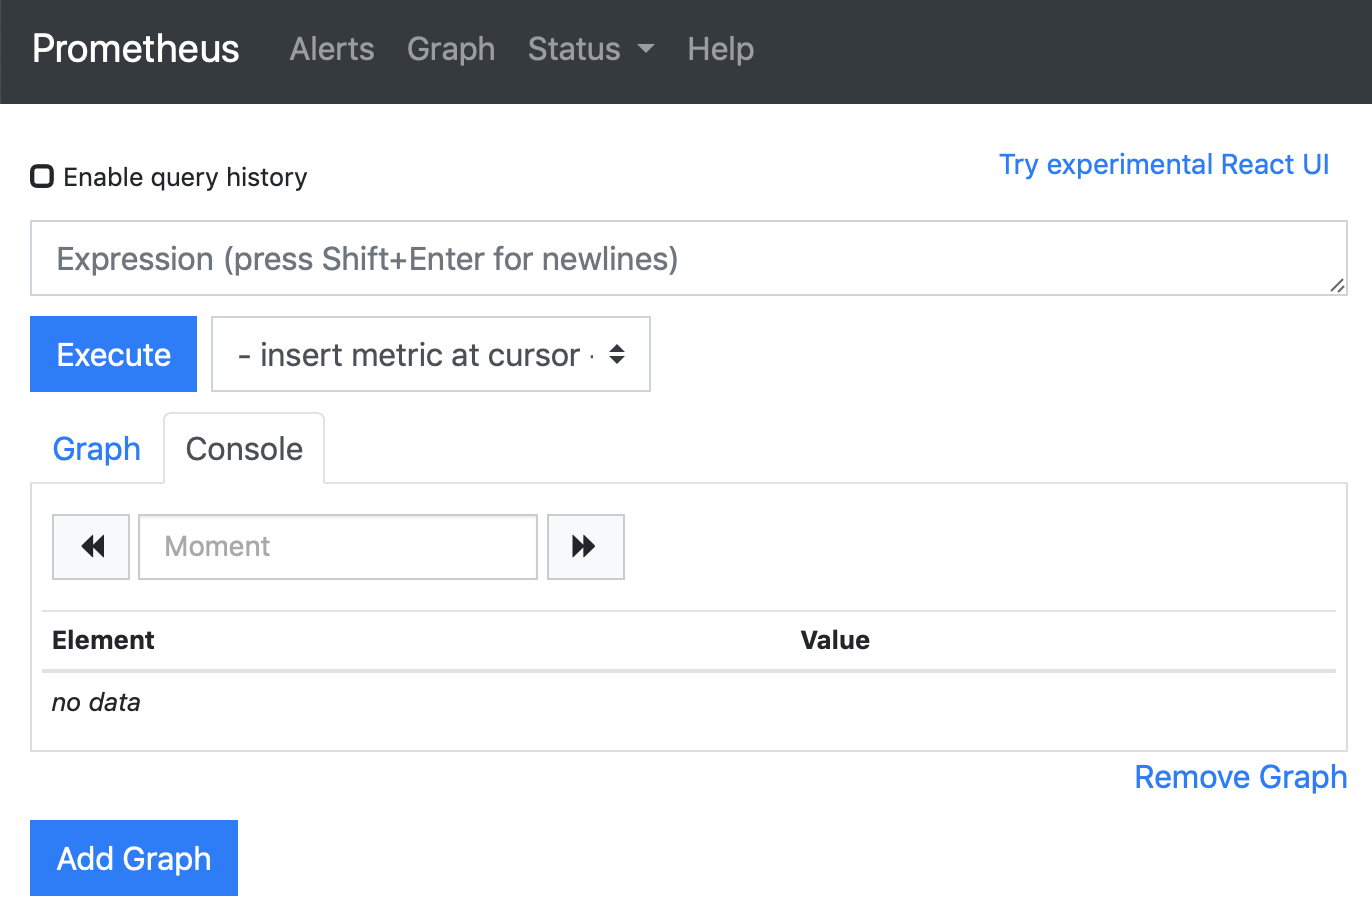
Once you confirm that Prometheus starts, replace the contents of prometheus.yml with the following:
# my global config
global:
  scrape_interval: 15s # Set the scrape interval to every 15 seconds.

scrape_configs:
  - job_name: 'opentelemetry'
    # metrics_path defaults to '/metrics'
    # scheme defaults to 'http'.
    static_configs:
- targets: ['localhost:9464']You can find an example application to use with this guide in the example directory. See what it looks like with metric monitoring enabled in the monitored-example directory.
Here's an overview of what you'll be doing:
- Install the required OpenTelemetry metrics libraries
- Initialize a meter and collect metrics
- Initialize and register a metrics exporter
To create metrics on NodeJS, you need @opentelemetry/sdk-metrics-base.
$ npm install \
@opentelemetry/sdk-metrics-baseYou need a Meter to create and monitor metrics. A Meter in OpenTelemetry is the mechanism used to create and manage metrics, labels, and metric exporters.
Create a file named monitoring.js and add the following code:
'use strict';

const { MeterProvider } = require('@opentelemetry/sdk-metrics-base');

const meter = new MeterProvider().getMeter('your-meter-name');
Now you can require this file from your application code and use the Meter to create and manage metrics. The simplest of these metrics is a counter. Create and export from your monitoring.js file a middleware function that express can use to count all requests by route. Modify the monitoring.js file so it looks like this:
'use strict';

const { MeterProvider } = require('@opentelemetry/sdk-metrics-base');

const meter = new MeterProvider().getMeter('your-meter-name');

const requestCount = meter.createCounter("requests", {
  description: "Count all incoming requests"
});

const boundInstruments = new Map();

module.exports.countAllRequests = () => {
  return (req, res, next) => {
    if (!boundInstruments.has(req.path)) {
      const labels = { route: req.path };
      const boundCounter = requestCount.bind(labels);
      boundInstruments.set(req.path, boundCounter);
    }

    boundInstruments.get(req.path).add(1);
    next();
  };
};
Now import and use this middleware in your application code:
const { countAllRequests } = require("./monitoring");
const app = express();
app.use(countAllRequests());
Now when you make requests to your service, your meter will count all requests.
Note: Creating a new labelSet and binding on every request is not ideal because creating the labelSet can often be an expensive operation. Therefore, the instruments are created and stored in a Map according to the route key.
Counting metrics is only useful if you can export them somewhere where you can see them. For this, w'ere going to use Prometheus. Creating and registering a metrics exporter is much like the tracing exporter above. First you need to install the Prometheus exporter by running the following command:
npm install @opentelemetry/exporter-prometheusNext, modify your monitoring.js file to look like this:
"use strict";

const { MeterProvider } = require('@opentelemetry/sdk-metrics-base');
const { PrometheusExporter } = require('@opentelemetry/exporter-prometheus');

const prometheusPort = PrometheusExporter.DEFAULT_OPTIONS.port
const prometheusEndpoint = PrometheusExporter.DEFAULT_OPTIONS.endpoint

const exporter = new PrometheusExporter(
  {
    startServer: true,
  },
  () => {
    console.log(
      `prometheus scrape endpoint: http://localhost:${prometheusPort}${prometheusEndpoint}`,
    );
  },
);

const meter = new MeterProvider({
  exporter,
  interval: 1000,
}).getMeter('your-meter-name');

const requestCount = meter.createCounter("requests", {
  description: "Count all incoming requests"
});

const boundInstruments = new Map();

module.exports.countAllRequests = () => {
  return (req, res, next) => {
    if (!boundInstruments.has(req.path)) {
      const labels = { route: req.path };
      const boundCounter = requestCount.bind(labels);
      boundInstruments.set(req.path, boundCounter);
    }

    boundInstruments.get(req.path).add(1);
    next();
  };
};
Ensure Prometheus is running by running the prometheus binary from earlier and start your application.
$ npm start

> @opentelemetry/getting-started@1.0.0 start /App/opentelemetry-js/getting-started/monitored-example
> node app.js

prometheus scrape endpoint: http://localhost:9464/metrics
Listening for requests on http://localhost:8080
Now each time you browse to http://localhost:8080 you should see "Hello from the backend" in your browser and your metrics in Prometheus should update. You can verify the current metrics by browsing to http://localhost:9464/metrics, which should look like this:
# HELP requests Count all incoming requests
# TYPE requests counter
requests{route="/"} 1
requests{route="/middle-tier"} 2
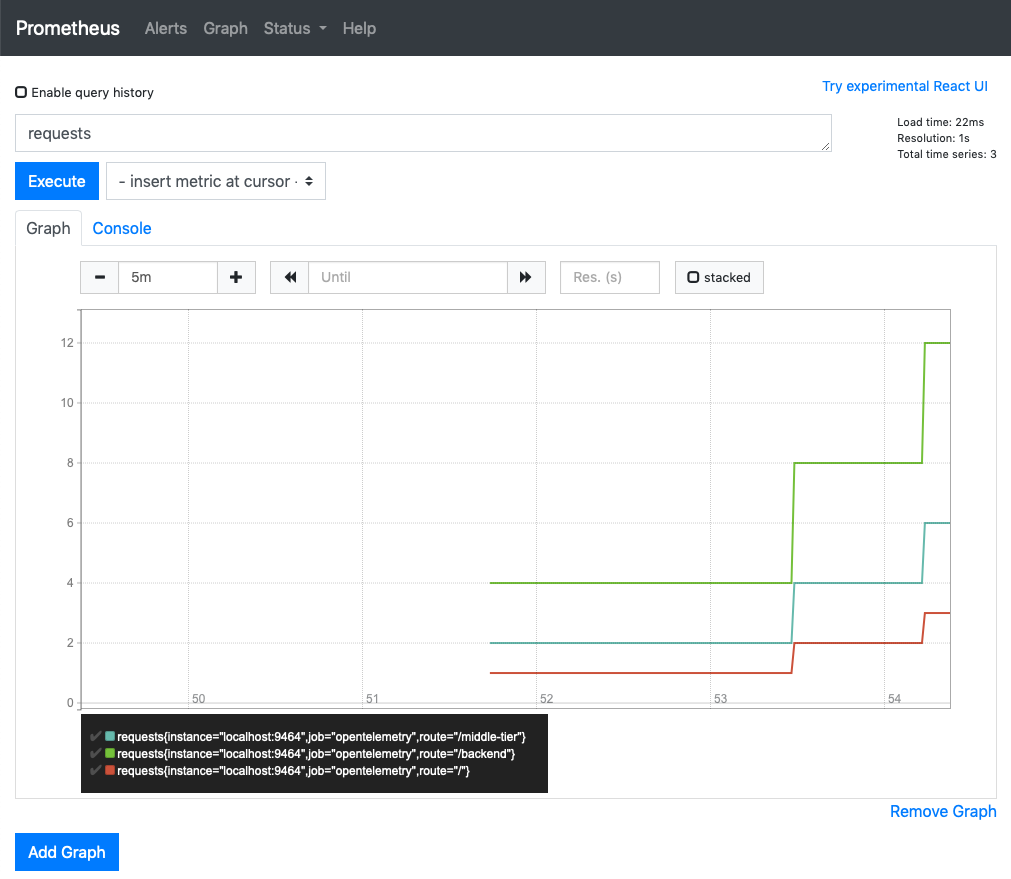
requests{route="/backend"} 4You should also be able to see gathered metrics in your Prometheus web UI.