[1.6.1] 100% CPU on Ubuntu server, caused by client? #9796
Comments
|
Not sure about the cause but perhaps try testing with a Galaxy deploy and see if you can recreate the problem there. Would add some extra data to help triangulate down to the root cause. From the logs it looks like mongo communication is involved somehow so perhaps check the metrics on your mongo cluster and see if anything looks suspicious. When you say "when a particular client connects" did you mean one particular customer or "one client" more like, "our desktop client"? If one particular client, have you been able to reproduce it in a test environment using their credentials/configuration? |
|
@alanning our server setup consists out of multiple microservices (backoffice, operational, scheduled tasks, api, customer, etc.) and is hosted on DigitalOcean. Our database instance is hosted with MongoDB Atlas. We managed to resolve the issue by either (1) shutting down ALL our production servers which were connected to MongoDB (at the same time) or (2) logging out all connected users (by updating all users). At this point we were spray painting with possible solutions, hoping something would stick. Before doing so we tried several other options like shutting down our services one by one, but once the container which was experiencing the issue spun up again the issue reappeared (even when we deployed an instance on a completely new server). In addition to that we assumed some kind of infinite loop in our code (resulting from poorly written Collection Hooks) could be the issue, but none of these changes did any good. I did not mean a specific client (like Cordova/Browser/Desktop) but rather one specific session on one device. This is what we assumed as the issue reappeared x seconds after restarting the instance where x would be longer if we left down the microservice longer (which would result in a longer timeout between reconnect attempts). Judging from the lodge we concluded there would have to be a MongoDB related issue as well, we checked the logs and found some (limited, non-recurring) limited key errors which appeared right before the issue started, but we have not been able to reproduce this behavior. As the issue is solved for us now I'm going to leave it at this, but it might be worthwhile to investigate which issues could result from a client continuously writing objects with duplicate keys to MongoDB (as this is the most probable scenario judging from all the details). |
|
Today the issue re-appeared; we would really like to find the source of this issue. Any thoughts on finding the cause would be appreciated! |
|
What version of Meteor are you running? I would work towards reproducing the issue by replicating that problem client's data/session in your test environment. Once you can reproduce it then you can start isolating different parts to find the culprit. Does MongoDB Atlas provide any relevant metrics for the timeframe in question? |
|
Meteor 1.6.1. We too would like to replicate the issues, but other than that it will probably have something to do with MongoDB. At present we don't even know how to reproduce the issue in production. We have a specific timestamp when the issue (at least, the high CPU load resulting from the issue) started, so we might be able to get some more information from the logs. To that effect I searched all our Collections looking for objects which were created/updated within 3 minutes of the issue appearing (the CPU usage increases from 5% to 100% in a matter of seconds), but to no avail. In addition to that we looked through the MongoDB Atlas metrics but they didn't show any significant increase in CPU, bandwidth, connections, whatsoever. This makes us think that, whereas the problem might be caused by some specific connection/data, the result is only measurable within the code. Could it be that Meteor think a document is updated all the time and attempts to publish changes to all clients, but it is actually not? Are there any other profilers we could run or logging we could enable to further narrow down the issue? |
|
I would like to join in this investigation. I too am experiencing a similar issue. Production servers jump to 100% at random moments, but always during working hours. First I thought I had a memory leak, or indeed an infinite loop somewhere. But after testing & debugging for a week, I still haven't found a thing. Even putting the server under load with
Any handles you can give us would be highly appreciated. Running Meteor 1.6.1 on Ubuntu via PM2. |
|
I have a sneaking suspicion that the issues listed here are caused by Fiber spikes. See #7747 for more details. This is a known issue and still happens with current day Meteor (the repro in that issue still shows the Fiber spike after updating to 1.6.1.1). That issue was closed due to inactivity, but if anyone is interested in digging into this further, the details in that issue should help. |
|
@hwillson interesting! In our particular app clients are subscribed to +/- 15 collections out of which an entry into one collection causes a cascading insert and update on other collections. Is there some way to easily try out the patch which sets the fiber pool size? Also could you sneak in a peek into the logs (or is your suspicion already based on those?) and share what you make out of of them? To me it looks like Meteor thinks that there are constantly changes in the data, while this is in actuality not the case. |
|
@smeijer just to make sure we are experimenting the same issue; the CPU load increases to 100% within a matter of seconds and remains there. The issue disappeared upon restarting Meteor (but in our initial scenario it resurfaced right away, whereas now it has been gone for a day). Do you also make use of quite a few subscriptions, or update a significant amount of documents in a collection to which some clients are subscribed at some point? |
|
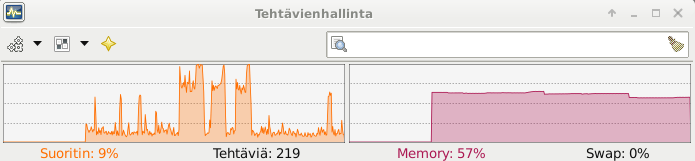
Yes. The CPU increases to 100% within a matter of seconds. Below you'll find a CPU log of the past two weeks. I've tried letting it run, to see if it come down it selves, but that didn't happen. (50% is 100% of 1 of the 2 cores) There is no other process running beside the meteor bundle and pm2. And you'll see on the chart that there is power enough for normal operations. Yes, the issue disappeared upon restarting Meteor Regarding to the subscriptions; I'm in a process of migrating away from publish / subscribe / methods, while going full graphql. So there aren't a lot of subscriptions in my application, but the ones that are still there, use quite a bit of data (geojson transport). I'm not sure what you feel significant, but I wouldn't say so. I have a write-heavy application. And yes, these are the "busy hours". But you see on my CPU chart that there should be performance enough. |

|
Is there a way I can count / log the number of active fibers? To see if / when I reach the 120 named in the Fiber thread? |
|
@hwillson thanks! One questions: does this log the number of active fibers or the number of fibers created (all time)? I believe it to be the latter, according to this: laverdet/node-fibers#85 But I'm not entirely sure how Meteor handles Fibers locally, so these numbers might in fact be the same thing. @smeijer this might also be interesting: laverdet/node-fibers#91 |
|
Added: To our /server/main.js file in production. Let's see what happens. |
|
I'll read those two issues tomorrow, but to share some results already. After a cold start, and just clicking away in my local dev environment: I don't see the I do use async / await heavily on the graphql part. And triggering 'fire and forget' actions there. (mongo update, and not waiting for results). import numeral from 'numeral';
import Fiber from 'fibers';
import logger from '../logger';
setInterval(() => {
const { rss, heapTotal, heapUsed } = process.memoryUsage();
const { fibersCreated, poolSize } = Fiber;
log.trace(
{ rss, heapTotal, heapUsed, fibersCreated, poolSize },
'heapUsed %s heapTotal %s rss %s fibers %d poolSize %d',
numeral(heapUsed).format('0.000 ib'),
numeral(heapTotal).format('0.000 ib'),
numeral(rss).format('0.000 ib'),
fibersCreated,
poolSize,
);
}, 5000).unref(); |
|
I'm using Meteor 1.6.0.1, having same problems, adding this comment to follow this issue. |
|
@xet7 does your problem also occur randomly and do you suspect it to be related to subscriptions/observing changes? Do you have any more information that is relevant from the other thread(s)? |
|
Setup is like mentioned at https://github.com/wekan/wekan-mongodb/issues/2#issuecomment-380606330 Also when tested with 4 EC2 instances without Docker, result is same, node has 100% CPU usage. Oplog should be setup correctly, I'm not sure. Problem is with Wekan https://wekan.github.io and all other Meteor.js projects, on powerful servers, and on Raspberry Pi small projects, so all new projects start with some other than Meteor.js, because of problems with Meteor.js CPU usage. |
|
@hwillson could you provide some more information on what sort of scenario's could cause such a Fiber spike? This could help us find the offending code portions in our application code. |
|
Is this still the same fiber issue that can be reproduced with this? |
|
So I guess this is a way to track the currently active fibers: import numeral from 'numeral';
import Fiber from 'fibers';
const runFiber = Fiber.prototype.run;
Fiber.fibersActive = 0;
Fiber.prototype.run = function runWithCount(...args) {
const wasStarted = this.started;
try {
runFiber.apply(this, args);
} finally {
Fiber.fibersActive +=
wasStarted && !this.started ? -1 : !wasStarted && this.started ? +1 : 0;
}
};
setInterval(() => {
const { fibersActive, fibersCreated, poolSize } = Fiber;
console.log(`fibersActive ${fibersActive}/${poolSize} fibersCreated ${fibersCreated}`);
}, 5000).unref();Logging statements like: I had a case where |
|
I tried the repro code here:
|

|
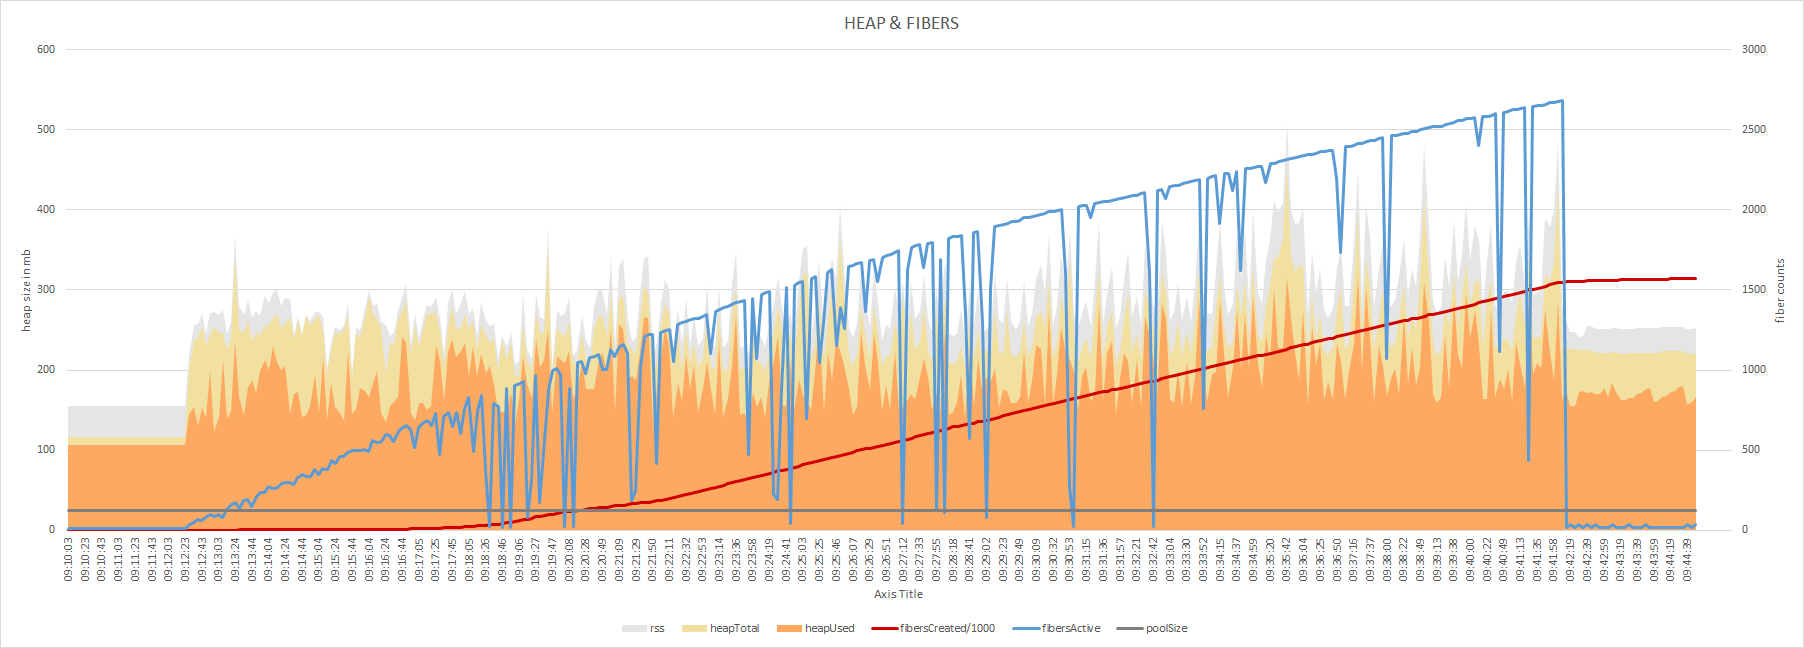
Running artillery on my local environment. I'm simulating the HTTP get request to get an initial page, which is using Turns out, the number of fibers is running trough the roof. Although, it does return below the pool size, the used memory does not.
I've scaled the Worth mentioning, I've killed artillery before it finished. Because it started to be terribly slow. I'll try tuning the number down. But I think it will be useful to run this code in production, to get some real data. |
|
So I've been logging production for a day now, and the number of active fibers are settled around ~25. (based on the code posted above). In the meanwhile, I've also scaled one server up. I've been running the same amount of instances as the server has cores (pm2 I've been playing a bit with the That does also confirm another scenario. To debug this issue, I've implemented a As I've been restarting the services quite often these days to implement debugging options/logging statements, the services haven't gone stale in the last 24 hours. I guess I have to wait now. |
|
Stable at 37 or 38 fibers here. |
|
Creating a heap-dump in dev mode (on a windows pc), throws an exception here. I've searched for this error, and found a good explanation at stackoverflow
So can this issue be related to the other segmentation bugs reported here? There are a lot lateley due to a bug in node. I have no idea why I don't see this error code on production. But the case is, on my dev machine a heap-dump kill's meteor, with this error, and restarts the instance. On production, sometimes the snapshot works, sometimes it causes the CPU to hang at 100%. But when the snapshot was made successful, the process is restarted somehow. Can a For reference, my heap-dumping-code: import heapDump from 'heapdump';
import path from 'path';
export function writeSnapshot(savePath) {
try {
const filename = `${Date.now()}.heapsnapshot`;
heapDump.writeSnapshot(path.join(savePath, filename), () => {
console.log('Saved heap snapshot to disk.');
});
} catch (ex) {
console.error('Err saving heap snapshot');
}
}
setTimeout(() => {
setInterval(() => {
writeSnapshot(process.env.PROFILE_DATA_PATH);
}, ~~process.env.HEAP_DUMP_INTERVAL * 1000).unref();
}, ~~process.env.HEAP_DUMP_INTERVAL * 1000); |
|
@benjamn the logic being that the issue in the issue in this thread also triggers a lot of Fibers which are never returned to the pool. Maybe a nice start to verify this would be running the reproduction listed in the older Fiber spike issue mentioned by hwillson? |
|
@KoenLav thanks for your effort on this, |
|
@vinaykevadia we managed to mitigate the issue in one of our services by limiting the amount of 'hard calculation' we are performing there. We are however currently experiencing this issue again, in another service where reports are generated based on a decent amount of data. I'm working on profiling this specific issue now. The only thing that has helped for us, so far, is spray painting with solutions and hoping somethings sticks. |
I solved it by removing almost all publications, and replace them by polling. Try to find your most expensive publication, and get rid of that one first. |
|
@KoenLav, I am a bit curious about your situation though.
Do I understand correctly, that your users (/clients), keep their browser open for several months? No reboot, or even a simple F5 browser refresh? I think that if something like this could indeed be a problem, that Meteor should add the (optional) refreshing of subscriptions on an given interval to the core. If I understnad it correctly, and that's what your problem fixed. |
|
@smeijer we provide a cash register system for hospitality establishments based on a combination of Meteor, React, Electron and Cordova (slowly migrating to React Native). Some of these cash registers (behind a bar, for instance) will just be "always on". Hence subscriptions are never refreshed (unless we do so manually). Before we used to have a monolithic application, as such reports and the like were also generated in the same application (which was just poor design) and this may have been the cause of the issue there (rather than the long-standing publications). Now we have migrated these reports to the backoffice service, which is accessed via the browser (rather than Electron/Cordova), and the problem reappeared. Hence it's unlikely to have anything to do with (long-standing) publications (in this specific case). We have isolated the cause of the issue, which is generating a big (but nog huge) report based on sales data for the past year, and have instrumented the application to allow for easy profiling based on the qualialabs:profile package by @veered. In my opinion the issue isn't that the CPU spikes to 100% (I mean, that can just happen, especially on computationally heavy tasks), but rather the fact that it remains at 100% CPU even after completing the task (which seems to be happening right now). I intend to provide a profile of the application while it is performing the heavy computations (which I don't think will render much, if any, interesting results) and one after it has finished the heavy computations (which I expect will show some kind of endless loop in Meteor/Fiber/Node/V8 internals). |
|
This isn't meant to be a solution to the problem, but as a work-around and perhaps a more optimized approach to generating these reports, have you considered using Meteor Methods to gather and return the data? Why use pub-sub and "real-time" data for a static report that is pulling a year's worth of data? |
|
@evolross this may not have been clear from my earlier comment, but generating the report is the issue (not subscribing to it afterwards). The issue also appears when we only generate and don't even subscribe at a later point in time. Your point is valid nonetheless, from an architectural perspective, but not relevant for this specific issue. Besides the end result of aggregated data is still less than 128KB, so subscribing shouldn't be an issue (although I agree it's also not necessary). |
|
This probably isn't helpful because you mentioned nothing has changed but I've seen issues like this time and time again in our apps when the size of certain publications gets too big and/or when there are too many subscribers to large publications. Just yesterday I refactored one of our apps that was subscribing to a (static) collection that has grown over the years to hundreds of thousands of documents for admin users (because they could see everything). Generally performance was ok, but one admin signing in brought the entire server to a halt for minutes on end, if not for good. By getting the data via a So, based on many experiences with this over the past 5 years I'd strongly recommend for any production app to use Meteor Methods (or these days just GraphQL) for anything that doesn't absolutely need updates in real-time. |
|
@ephemer What are you using to do a "mongo aggregation on the server side"? Is this a certain package? |
|
In Wekan https://wekan.github.io , these fixes were implemented to improve performance:
There is still a lot more possibilities to improve, like for example using new MongoDB 4.x features like aggregate queries. Wekan has Meteor 1.8.1 and MongoDB 4.0.7 in testing at meteor-1.8 branch, so it works in Docker, so when sometime I get Meteor 1.8.1-based Wekan also working in Snap and Sandstorm then it's possible to start looking at aggregate queries, or even earlier, but currently Wekan is fast enough so it's not urgent yet. Currently Snap and Sandstom Wekan still uses Meteor 1.6.x. |
|
@ephemer we still have a subscription to a collection which receives a lot of inserts, updates and deletes. However we cancel the subscription and resubscribe every 6 hours, limiting the 'exposure' to this potential issue. Additionally we used to provide a reporting service (which was poorly written to begin with) within our operational service; this reporting service could clog up the entire server leaving no room to process the oplog, which caused another issue (fallback to polling). All-in-all we noticed that subscriptions perform poorly when they receive either a large number of events or limited events with large payloads. |
|
This issue has been automatically marked as stale because it has not had recent activity. It will be closed if no further activity occurs. Thank you for your contributions. |
|
So I noticed @vlasky mentioning a performance regression in Meteor 1.9 (Node 12) and I thought let's check how the Fiber bomb repro performs on 1.9 vs 1.8: Press set and unset 5 times (set, unset, set, unset, etc.), 10 presses total (5 each), this will create +/- 100.000 fibers (depending on system speed). On Meteor 1.9 the CPU will be 100% for 180 sec I think, again, there is definitely an issue in Node.js which needs resolving, but I would like to repeat that I think Meteor should also make improvements, like: You can see the performance improvements from that PR in the Fiber repro repository clearly. |
|
So what's the story with this? Definitely a blocker for us to upgrade to Meteor 1.9. |
|
@elie222 the problem has been solved. The release version of Meteor 1.9 runs well. |
|
@evolross sorry I didn't get notified about your question here. In case you're still wondering, a mongo aggregation on the server side performed in a method looks like this (no libraries etc. required): |
|
This issue has been automatically marked as stale because it has not had recent activity. It will be closed if no further activity occurs. Thank you for your contributions. |
|
Has this issue been fixed? I doubt that closing this one due to inactivity alone, is the right thing to do. |
|
Nope. The underlying issue in Node.js which caused fiber bombs to bring the server to a crawl has been resolved, but fiber bombs still exist and the reproduction repo still shows hugea huge slowdown when a large amount of documents are updated when subscribed to. My PR, outstanding for about two years now, addresses this issue. |
|
We don't want to hide/close unsolved important issues, this was just a rename of labels that is already finished and stale-bot is working as expected again. |
We are experiencing consistent 100% CPU usage on one of our Meteor deployments. This issue seems to have appeared out of nowhere (not after a of a new version).
What we already tried: create a new server with the same specs and deploy to that server. When we switch over our DNS to the new server at first all is well; but (we think) when a particular client connects the Node process starts using 100% CPU.
We're deploying Meteor to a Ubuntu host using MUP (which instantiates a Docker container consisting of the meteord base image and our bundle). The image has NodeJS 8.9.4 and NPM 5.6.0.
Any pointers as to how to pinpoint this issue would be greatly appreciated!
We believe this is the most interesting portion of the V8 profiler we ran on the logs (https://paste2.org/zPsHbDya):
The text was updated successfully, but these errors were encountered: