Splunk RUM data model represents the following logical entities:
| Entity | Description |
|---|---|
| Trace | Set of events, triggered as a result of a single logical operation, consolidated across various components of an application. Single trace contains events that cross process, network and security boundaries. RUM trace can for example be initiated when someone presses a button to start an action on a website. In case the RUM is used in combination with APM in this example, the trace will represent calls made between the downstream services that handled the chain of requests initiated by this button being pressed. |
| Span | An operation within a transaction. One span encapsulates the logical name and start and end timestamp of the operation as well as the events and attributes enriching the information captured. A span may have a reference to its parent span and zero or more causally-related spans |
| Session | A collection of traces that correspond to the actions a single user takes when interacting with an application over a period of time. By default, a session lasts until there's 15 minutes passed from the last user interaction. The maximum session duration is capped to four hours. An example session in an e-commerce application might consist of traces representing the following user actions: login, add-to-cart, check-out, apply coupon, submit payment method. |
| Interaction | Reflects the action the user conducts within the user interface. Common interaction types include mouse clicks, taps on a touchscreen and keyboard events. |
| User | A representation of the user interacting with the application. An user can be represented with the username, email address or a synthetic identifier. Synthetic representation is preferred in situations where PII regulations do not allow identifying the real user. By default, Splunk Browser Agent is not detecting the identity. Mapping a trace to the specific user is possible via manual instrumentation using the Browser Agent API. |
The data model closely follows OpenTelemetry’s semantic conventions. Deviations are kept minimal.
All of the data is currently sent in batches, containing modified Zipkin spans encoded as JSON objects. A single batch can contain one or more spans. Spans have universal properties and in addition every instrumentation can add their own properties.
| Name | Type | Description |
|---|---|---|
id |
string |
Unique 64bit identifier generated for this span within the trace. |
parentId |
string |
Parent span ID or absent if this the root span in a trace. |
name |
string |
Logical operation this span represents (such as /pay, /customers/{1}/details, etc) |
duration |
number |
Duration in microseconds. |
traceId |
string |
Unique 128bit identifier, set on all spans belonging into the trace. |
timestamp |
number |
Epoch microseconds of the start of this span, possibly absent if incomplete. |
tags |
object |
Additional context, allowing to search and analyse the spans based on specific tags. |
annotations |
array |
Associates events that explain latency with the time they happened. |
| Name | Type | Description |
|---|---|---|
app |
string |
Application name, as set in configuration. |
component |
string |
Instrumentation name that produced this span, such as document-load. |
location.href |
string |
Value of location.href at the moment of creating the span. |
splunk.rumSessionId |
string |
Session ID, captured from the _splunk_rum_sid cookie. |
splunk.rumVersion telemetry.sdk.version |
string |
Version of the Splunk RUM SDK instrumenting the application. |
splunk.scriptInstance |
string |
64bit id. Every instance of splunk-rum.js gets assigned its own id eg. to distinguish between different open tabs within the same browser window sharing the same session. |
splunk.scriptInstance |
string |
64bit id. Every instance of splunk-rum.js gets assigned its own id eg. to distinguish between different open tabs within the same browser window sharing the same session. |
ot.status_code |
string |
Always “UNSET” |
telemetry.sdk.language |
string |
Always "webjs" |
telemetry.sdk.name |
string |
Always "@splunk/otel-web" |
All spans are annotated with performance timings, as specified by the W3C specification. The timestamps represent the HTTP connection lifecycle:
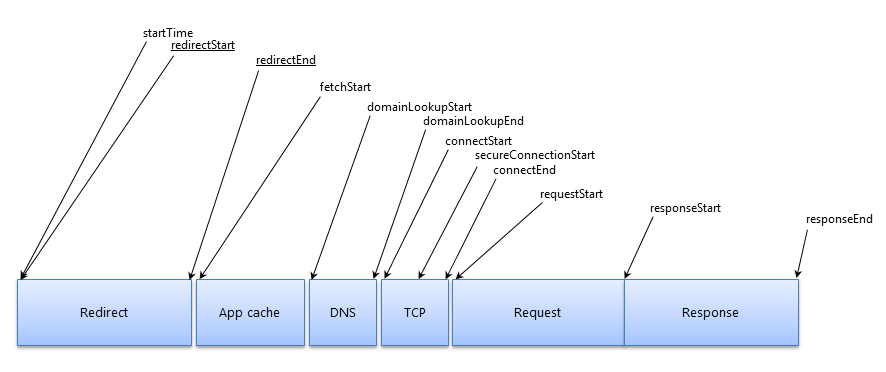
| Name | Description |
|---|---|
fetchStart |
A timestamp immediately before the browser starts to fetch the resource. |
domainLookupStart |
A timestamp immediately before the browser starts the domain name lookup for the resource. |
domainLookupEnd |
A timestamp representing the time immediately after the browser finishes the domain name lookup for the resource. |
connectStart |
A timestamp immediately before the browser starts to establish the connection to the server to retrieve the resource. |
secureConnectionStart |
A timestamp immediately before the browser starts the handshake process to secure the current connection. |
connectEnd |
A timestamp immediately after the browser finishes establishing the connection to the server to retrieve the resource. |
requestStart |
A timestamp immediately before the browser starts requesting the resource from the server. |
responseStart |
A timestamp immediately after the browser receives the first byte of the response from the server. |
responseEnd |
A timestamp immediately after the browser receives the last byte of the resource or immediately before the transport connection is closed, whichever comes first. |