Node Startup Improvement #27196
Comments
|
perf stat -e cycles,instructions
|
|
Duplicate of #17058? |
|
Yup. Ultimately you want to use startup snapshot instead of code cache. That way you also won't run into GCs. This is currently blocked by refactoring startup into a static and a dynamic (depending on environment and command line args) part. |
I believe I have done most of this part, another part left would be a more organized way to bookkeep the external reference registration. We could um, copy-paste whatever external references created by existing module initializers run during bootstrap for now if we just want to do an initial implementation, but as people keep adding new FunctionTemplates etc., it's not going to be very maintainable (and if it simply crashes when the references are not properly registered without proper hints, it would be quite confusing to contributors who are not familiar with the snapshot process). Anyway I am working on a new iteration of #17058 and so far it's safe to snapshot before pre-execution. I should be able to have a valid POC soon, the bookkeeping part may or may not block it but that would be much easier to tackle than the bootstrap refactoring. |
|
There might be some short-term low-hanging fruit to reap. There are a lot of intertwined dependencies that are probably not strictly necessary. An instrumented diff --git a/src/node_contextify.cc b/src/node_contextify.cc
index 087727d93a..1266a3d338 100644
--- a/src/node_contextify.cc
+++ b/src/node_contextify.cc
@@ -985,6 +985,10 @@ void ContextifyContext::CompileFunction(
// Argument 2: filename
CHECK(args[1]->IsString());
Local<String> filename = args[1].As<String>();
+ {
+ Utf8Value filename_s(args.GetIsolate(), filename);
+ printf("%s %s\n", __func__, *filename_s);
+ }
// Argument 3: line offset
CHECK(args[2]->IsNumber());
diff --git a/src/node_native_module.cc b/src/node_native_module.cc
index 08c0ab16e3..62e332574b 100644
--- a/src/node_native_module.cc
+++ b/src/node_native_module.cc
@@ -299,6 +299,7 @@ MaybeLocal<Function> NativeModuleLoader::LookupAndCompile(
Local<String> source = source_it->second.ToStringChecked(isolate);
std::string filename_s = id + std::string(".js");
+ printf("%s %s\n", __func__, filename_s.c_str());
Local<String> filename =
OneByteString(isolate, filename_s.c_str(), filename_s.size());
Local<Integer> line_offset = Integer::New(isolate, 0); |
|
@bnoordhuis BTW you can get a more complete list (including the bindings loaded) with A lot of these dependencies come from the fact that we set the browser globals by default. We could make them load lazily before snapshot is implemented and shipped, but after snapshot is in core we would want them to be included in the snapshot - I believe I've managed to clean up most of them so that they are now side-effect free and can be included in the snapshot. |
|
Not everyday you get to see a 2X improvement for
We will analyze this some more. Let us know where we can help. |
|
The new trace for empty shows it is down to 21ms. Very impressive. @hashseed there is a 1ms of GC Scavenge around 15 ms. Any suggestions? There is also a bit of sparse script_parse_and_compile bits of green. Is that loading the cached code? Would be nice to batch it and cut some more.
|

|
FYI... Enabling the node.vm trace event category will cause the trace event file to include the file names of the core modules so you can see exactly how long each one adds during bootstrap. Enabling the node.bootstrap category will include milestone events so you can see exactly how long between various bootstrap phases. |
|
Thanks @jasnell . Yes I did trace it to include those categories, but the file names are not being included. Maybe I should report that seperately. Let me know if it works for you correctly. It was hard to see the bootStrapComplete in the Chrome view. I looked at the logfile after it was processed with BootStrap is down to 17ms.
|
|
Hmm.. will have to test in a bit that it still works as expected. |
|
Other events for bootStrap. If I am reading this right, 1ms for nodeStart and 4ms for v8Start. We have to account for the other 12ms
|
|
Do I understand correctly that these data points are from embedding code cache for internal modules? In that case, a GC is quite understandable. Everytime we deserialize code for a module, there is going to be a quite sizeable allocation. If we are aiming for eventually using startup snapshot, then I don't think there is any point in tweaking GC to squeeze out that 1ms. Maybe you want to play around with --initial-old-space-size though. |
|
BTW with #27147 you can capture a CPU profile with more detailed call stacks. For instance when running
As you can see in the screenshot, basically every startup mode consists of three phases (modulo per-context scripts that runs too early to profile at the moment):
(Note that actually 1 and 2 can be merged but we still keep them separate for readability) The execution of the per-context scripts as well as 1 and 2 above will be eliminated by the snapshot integration. Then we'll need to move as much as possible from 3 to 2 while preserving the invariant the there should be no environment-dependent code in 1 or 2.
As shown above the majority of time is spent on compiling native modules (with code cache in my branch) - this is not entirely eliminatable with the snapshot integration. At the moment to be safe we only load modules that are used during bootstrap on demand. We could load and cache more when building the snapshot, but we'll have to refactor and make sure that the modules loaded do not do anything environment-dependent (roughly means they need to be side-effect-free) during their first evaluation - this does not only apply to the JS code but also to the initializer of the bindings that they load. This issue is surprisingly common in the code base and it's a bit difficult to enforce the side-effect constraint at the moment (considering the native modules are all um...CJS) |


|
The conversation here appears to have stalled out. Should this remain open? |
|
closing as inactive for more than an year; pls re-open if there is still outstanding work |
|
BTW this is what I currently get with
It has improved after we shipped embedded snapshot for the bootstrap (step 1 and 2 are gone compared to #27196 (comment)), the remaining work is sketched out in https://docs.google.com/document/d/15bu038I36oILq5t4Qju1sS2nKudVB6NSGWz00oD48Q8/edit though the bigger goal is to enable user land snapshot for user applications :). Not sure how far we've gone compared to what we had in the OP (since I don't have the same machine to benchmark) but I am pretty sure we've improved a lot now with code cache and the snapshot and we've probably hit the goal of reducing the number to 10-15ms |

|
BTW the new tracking issue for snapshot integration is #35711 |
Is your feature request related to a problem? Please describe.
Node takes around 60ms to start on a modern Skylake Server, processing ~230M instructions to execute a mostly empty function (see below). From looking at the startup timeline view (using trace-events). During this time, it loads 56 JavaScript core library files and compiles them. Much of the startup time is due to that.
The test code.
The timeline view of Node Startup for the above empty program. The green parts are the compilation. There are 56 JavaScript files that are compiled.

Describe the solution you'd like
The compilation for these core libraries can be done ahead of time and cached and the entire generated code snapshot could be loaded at one shot. Multiple copies of node on the same machine could share it.
There is also some v8 GC activity that could be postponed to 100ms or later.
It would be great to get the startup to 10-15 ms in the default.
@joyeecheung @hashseed @jasnell @mcollina @addaleax
Describe alternatives you've considered
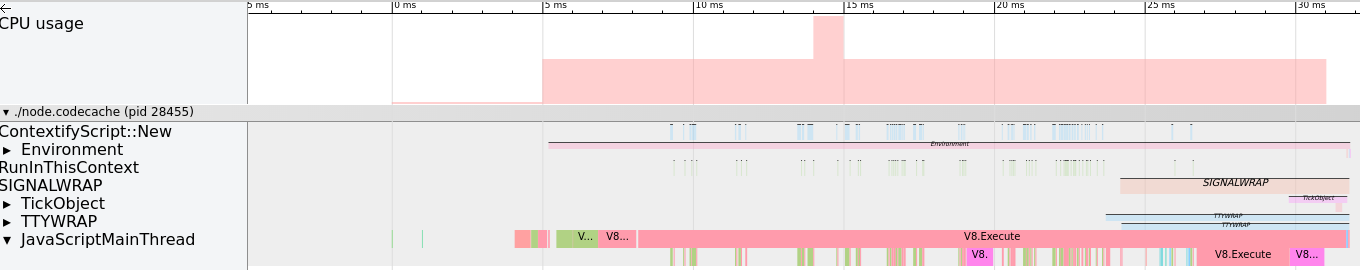
Using the codecache feature the compilation gets reduced. But each of the library compiled code gets loaded one at a time. Notice the green has reduced but each of the classes are still loaded one by one.
FaaS providers are also starting to keep pre-warmed instances
The text was updated successfully, but these errors were encountered: