Preview feature feedback: Prisma tracing (tracing)
#14640
Comments
|
With this, it's still not possible to "tag" prisma queries with the request id they are executed as part of, if i'm wrong please share how? For context please take a look at #10425 |
|
Iin slack it this was shared:
it would be very useful if we are able to attach request id of an http request to all queries which are created as part of the http request. (for logging, and for rate limiting) |
|
Please add this to the documentation (in some form):
I struggled for so long because I missed the |
|
It would be great to have a way to "label" prisma queries so that name can appear in the traces. In other words, if your label is create_a_user, instead of having |
|
I'd like to have another option in for the instrumentation package serialize: boolean, because it might not always be useful to pollute the spans with these prisma:*:serialize traces, I would like to disable it by default but give the option to enable it as necessary. |
|
It appears that prisma is sending db spans with an attribute of Also the span kind for the db traces are the default With these 2 changes I believe observability platforms like datadog and newrelic would classify these spans as DB operations properly. |
|
First of all, the new opentelemetry instrumentation is working great for us! There is just 2 things that bother us:
Thanks a lot! |
|
500% agreed with @alondayan2, Could be awesome if we could filter some traces like : Like https://www.npmjs.com/package/@opentelemetry/instrumentation-express is doing with |
You can sort hack your way to attach it when a span is started |
|
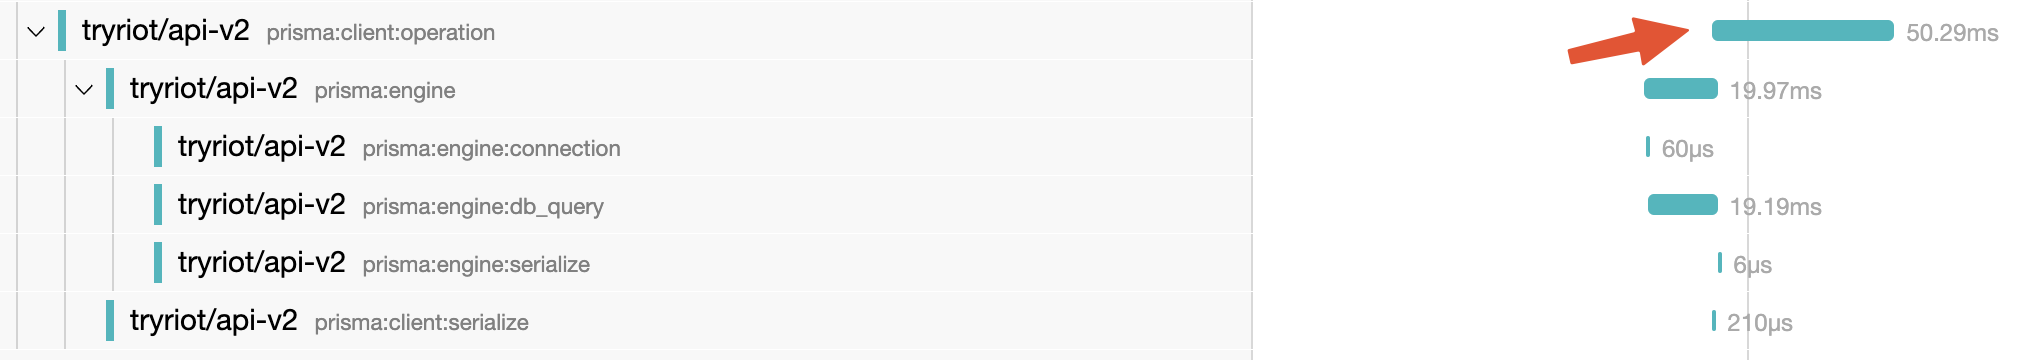
It seems Prisma have an issue in the span inclusion, the bar
Btw what are the others ~30ms in my example? |
This could work if you are using things like lambda function, but If you have one process where server is running that serves multiple requests this can't quite work. |
|
@safareli It can still work if you use AsyncLocalStorage for storing request id. |
|
Can someone explain what the Specifically, we will occasionally see relatively long instances of these spans for traces in an environment where the connection pool should already be warm (the database shows the expected number of connections from the client for the given connection_limit setting). That leads us to believe these are waiting for an idle connection from the pool. Are these spans the time takes to wait for a connection from the pool, or to create a new connection to the db, or both? I was hoping to use tracing to see if there is pool queuing for slow queries but I'm not sure I can distinguish queue waits vs new connection creations. Is that something that could be added as an attribute to the span (e.g. something like |
|
When running on apple m1(try on 2 macbooks) there's no spans with But it works perfect on linux OS: 13.1 same on 4.8.1 and 4.10.0-dev42 The script at the top of the code: |
|
Is there a way to get variables to show up in traces? Right now I just see stuff like this: But when I find a slow trace, I'd like to dig into the specific variables to see if I can reproduce the query and investigate further |
|
Unfortunately not. You can log them in logging, but that will not help with the traces obviously. Generally params are considered sensitive, so we never combined them back into the query and by default do not log or output them either. But good suggestions that for traces this might be beneficial (optional of course). |
I'm having issues with the tracing because of this. It seems as if the |
|
Update regarding the A relevant discussion here: |
I am not sure, I can agree on the I could see an option where you define multiple Prisma clients where ea interface PrismaClientOptions {
// ... current
/**
* @default "client"
*/
kind?: 'cron' | 'internal' | 'client' //(or it could be simply string)
}I can see myself using a special Prisma client for cron... |
|
i need a way to "merge" spans for prisma model calls that end up batched by the dataloader. for our GraphQL backend, we use prisma's dataloader functionality extensively to batch db queries for our GraphQL backend. we might have one GQL query that results in hundreds of for reference, the GraphQL instrumentation module has a i love the concept of OpenTelemetry, and think it's a brilliant decision for prisma to provide first-party support for it, but unfortunately this shortcoming makes it practically unusable for my application. |
|
Hey @mziwisky ! I've done some digging here and don't have a direct solution, but would encourage you to open up a specific feature request issue for something similar to the Until then, the best I can offer as a band-aid is our documentation on batching and sampling which may reduce your current load. |
|
@janpio Hey! It took me a while to understand that such queries are executed as many select queries behind the scenes. while the following queries are missing the traceparent, in this example: And I have no way to connect the span with the correct trace. I would expect that each sub query will contain the traceparent comment... p.s - I am also using client middleware to inspect the queries before execution, but the sub select queries when using include are not generating the same client operation, I think that the implementation still need to act as the client generated all the queries Thanks |
|
One thing I've noticed with this feature so far when integrating with Datadog is that we aren't able to get |
|
It would be great if the db.statement tag didn't include any trailing comments, see DataDog/dd-trace-js#1244 (comment) |
|
An observation from @rtbenfield:
|
|
Is there a way to get traces attributed to a particular client? Especially with read replicas, it would be tremendously useful to understand whether a span is hitting the primary or a replica. |
|
Generally the traces are directly connected to the Client that they are coming from. This might be more of a problem of the read replica extension - so maybe open an issue over there. |
|
For us it's better for our customers to have fewer spans with more enriched information |

|
What would you expect instead of what you showed above @Ankcorn? |
|
Thanks @janpio Ideally, an option to just have the root Prisma client span and also some hooks to capture the input and response from the Prisma Client. I can see how the current spans are awesome for debugging more complex performance issues but 90% of issues we see are just in the basic usage or doing too many queries on a route negatively effecting the page load perf rather than something internal to prisma |
Any updates on the missing "db.system"-field, which can be interpreted from the spec as required on all spans reported regarding a db-operation? |
|
Thanks for the explanations @Ankcorn - I think that makes a lot of sense for the common use cases. |
|
Is there a way we could somehow help get out #20113 sooner rather than later? |
|
Hi folks! We're big fans of Prisma and tracing! We've found our Prisma traces to be quite verbose -- way too many spans to be useful, and sometimes enough spans to crash our collector. Is there a way to configure Prisma traces to be only one span per Prisma call? |
|
It would be great if you guys could reduce the amount of spans, that would help us reduce our bills for otel. |
|
Hey ! Same on my side, I love having so much information, but having a way to reduce the spans would be amazing to reduce the costs on our side too 🙏 Thanks for the work ! |
Probably this is what you are looking for but it's still awaiting for review... |
|
Adam from Metis here. One thing that would be great to see is support for autoinstrumentation with out-of-process configuration from OpenTelemetry. See this link Autoinstrumentation enables turning open telemetry on by installing a couple of OTel libraries and setting some environment variables. This way users can enable instrumentation without modifying their application code at all. This works great for many libraries including pg (Postgres driver), Sequelize or web servers. See the list I think Prisma should support autoinstrumentation by environment variables as well (or generally, Prisma should integrate with OTLP to support any kind of autoinstrumentation). This way users would be able to enable OpenTelemetry with no application code changes, and could use tools like Metis out of the box. |
|
That is a great suggestion @adammetis. Do you maybe want to turn it into its own feature request? I think that is relevant and big enough to justify that. Thanks! |
|
This a minor issue, but Prisma uses the wrong value for
|
|
Hi, Can I ask a quick question, does the auto-instrumentation for Prisma capture errors from the $on('error') event? |
Please share your feedback about the
tracingfunctionality released in v4.2.0 in this issue.If you have any questions, don't hesitate to ask them in the
#prisma-clientchannel in the Prisma Slack.The text was updated successfully, but these errors were encountered: