Skip to content
New issue

Have a question about this project? Sign up for a free GitHub account to open an issue and contact its maintainers and the community.

By clicking “Sign up for GitHub”, you agree to our terms of service and privacy statement. We’ll occasionally send you account related emails.

Already on GitHub? Sign in to your account

JavaScript heap out of memory on Actions Test CI #5527

Closed
rarkins opened this issue Feb 20, 2020 · 12 comments · Fixed by #5542
Closed

JavaScript heap out of memory on Actions Test CI #5527

rarkins opened this issue Feb 20, 2020 · 12 comments · Fixed by #5542
Assignees
Labels
type:bug Bug fix of existing functionality

Comments

@rarkins
Copy link
Collaborator

rarkins commented Feb 20, 2020

Maybe signs of a memory leak in our tests?

FATAL ERROR: Ineffective mark-compacts near heap limit Allocation failed - JavaScript heap out of memory
 1: 0x8fa090 node::Abort() [/opt/hostedtoolcache/node/10.19.0/x64/bin/node]
 2: 0x8fa0dc  [/opt/hostedtoolcache/node/10.19.0/x64/bin/node]
 3: 0xb0052e v8::Utils::ReportOOMFailure(v8::internal::Isolate*, char const*, bool) [/opt/hostedtoolcache/node/10.19.0/x64/bin/node]
 4: 0xb00764 v8::internal::V8::FatalProcessOutOfMemory(v8::internal::Isolate*, char const*, bool) [/opt/hostedtoolcache/node/10.19.0/x64/bin/node]
 5: 0xef4c72  [/opt/hostedtoolcache/node/10.19.0/x64/bin/node]
 6: 0xef4d78 v8::internal::Heap::CheckIneffectiveMarkCompact(unsigned long, double) [/opt/hostedtoolcache/node/10.19.0/x64/bin/node]
 7: 0xf00e52 v8::internal::Heap::PerformGarbageCollection(v8::internal::GarbageCollector, v8::GCCallbackFlags) [/opt/hostedtoolcache/node/10.19.0/x64/bin/node]
 8: 0xf01784 v8::internal::Heap::CollectGarbage(v8::internal::AllocationSpace, v8::internal::GarbageCollectionReason, v8::GCCallbackFlags) [/opt/hostedtoolcache/node/10.19.0/x64/bin/node]
 9: 0xf043f1 v8::internal::Heap::AllocateRawWithRetryOrFail(int, v8::internal::AllocationSpace, v8::internal::AllocationAlignment) [/opt/hostedtoolcache/node/10.19.0/x64/bin/node]
10: 0xecd874 v8::internal::Factory::NewFillerObject(int, bool, v8::internal::AllocationSpace) [/opt/hostedtoolcache/node/10.19.0/x64/bin/node]
11: 0x116d9fe v8::internal::Runtime_AllocateInNewSpace(int, v8::internal::Object**, v8::internal::Isolate*) [/opt/hostedtoolcache/node/10.19.0/x64/bin/node]
12: 0x30128705be1d 
@rarkins rarkins added type:bug Bug fix of existing functionality ready labels Feb 20, 2020
@viceice
Copy link
Member

viceice commented Feb 20, 2020

Can be. 🤔 Only on node v10 or also on v12?

@rarkins
Copy link
Collaborator Author

rarkins commented Feb 20, 2020

This happened on node v10 on Actions because it was the only one running at the time (release). I haven't noticed it before. I get memory warnings locally on Node 12 on OSX when running jest though.

@viceice
Copy link
Member

viceice commented Feb 21, 2020

maybe related jestjs/jest#6399
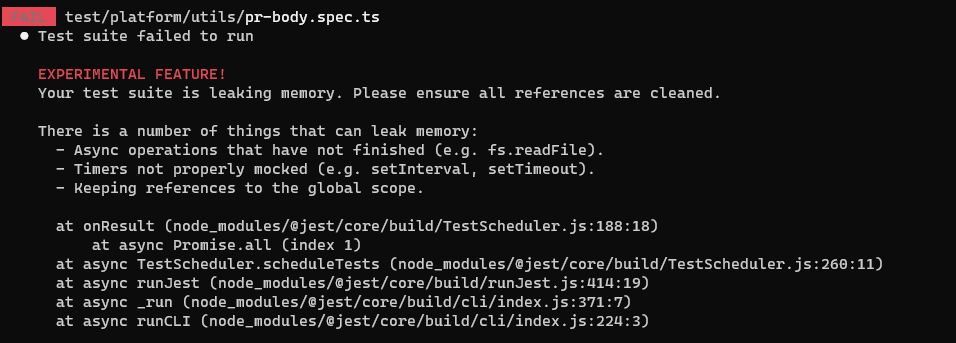
@rarkins
Copy link
Collaborator Author

rarkins commented Feb 21, 2020

On Mac I get this warning sometimes: Running coverage on untested files...A worker process has failed to exit gracefully and has been force exited. This is likely caused by tests leaking due to improper teardown. Try running with --runInBand --detectOpenHandles to find leaks.

Then when doing do:

<--- Last few GCs --->

[33694:0x110000000]   178700 ms: Mark-sweep 1703.1 (2069.6) -> 1673.5 (2062.4) MB, 924.2 / 1.4 ms  (average mu = 0.320, current mu = 0.316) allocation failure scavenge might not succeed
[33694:0x110000000]   178826 ms: Scavenge 1689.2 (2062.7) -> 1679.7 (2064.4) MB, 11.8 / 0.0 ms  (average mu = 0.320, current mu = 0.316) allocation failure 
[33694:0x110000000]   178887 ms: Scavenge 1691.8 (2064.6) -> 1682.8 (2066.3) MB, 11.5 / 0.0 ms  (average mu = 0.320, current mu = 0.316) allocation failure 


<--- JS stacktrace --->

==== JS stack trace =========================================

    0: ExitFrame [pc: 0x100931399]
Security context: 0x1566f6b008a1 <JSObject>
    1: deepCyclicCopyObject(aka deepCyclicCopyObject) [0x1566875068a1] [/Users/rhys/src/renovate/node_modules/jest-util/build/deepCyclicCopy.js:~35] [pc=0x532b7d08cfe](this=0x1566f92804a9 <undefined>,0x156685083691 <Object map = 0x156605f68701>,0x15665c5da589 <Object map = 0x15667de14ed1>,0x156656940691 <JSWeakMap>)
    2: deepCyclicCopy(aka deepCyclicCopy) [0x...

FATAL ERROR: Ineffective mark-compacts near heap limit Allocation failed - JavaScript heap out of memory

Writing Node.js report to file: report.20200221.063524.33694.0.001.json
Node.js report completed
 1: 0x10007f4b9 node::Abort() [/usr/local/bin/node]
 2: 0x10007f63d node::OnFatalError(char const*, char const*) [/usr/local/bin/node]
 3: 0x100176a27 v8::Utils::ReportOOMFailure(v8::internal::Isolate*, char const*, bool) [/usr/local/bin/node]
 4: 0x1001769c3 v8::internal::V8::FatalProcessOutOfMemory(v8::internal::Isolate*, char const*, bool) [/usr/local/bin/node]
 5: 0x1002fab75 v8::internal::Heap::FatalProcessOutOfMemory(char const*) [/usr/local/bin/node]
 6: 0x1002fc244 v8::internal::Heap::RecomputeLimits(v8::internal::GarbageCollector) [/usr/local/bin/node]
 7: 0x1002f9117 v8::internal::Heap::PerformGarbageCollection(v8::internal::GarbageCollector, v8::GCCallbackFlags) [/usr/local/bin/node]
 8: 0x1002f70fd v8::internal::Heap::CollectGarbage(v8::internal::AllocationSpace, v8::internal::GarbageCollectionReason, v8::GCCallbackFlags) [/usr/local/bin/node]
 9: 0x100302814 v8::internal::Heap::AllocateRawWithLightRetry(int, v8::internal::AllocationType, v8::internal::AllocationAlignment) [/usr/local/bin/node]
10: 0x10030288f v8::internal::Heap::AllocateRawWithRetryOrFail(int, v8::internal::AllocationType, v8::internal::AllocationAlignment) [/usr/local/bin/node]
11: 0x1002cf487 v8::internal::Factory::NewFillerObject(int, bool, v8::internal::AllocationType) [/usr/local/bin/node]
12: 0x1005f8ad5 v8::internal::Runtime_AllocateInYoungGeneration(int, unsigned long*, v8::internal::Isolate*) [/usr/local/bin/node]
13: 0x100931399 Builtins_CEntry_Return1_DontSaveFPRegs_ArgvOnStack_NoBuiltinExit [/usr/local/bin/node]

@viceice
Copy link
Member

viceice commented Feb 21, 2020

image

🤔

@viceice
Copy link
Member

viceice commented Feb 21, 2020

image
Thats even more strange

@rarkins
Copy link
Collaborator Author

rarkins commented Feb 21, 2020

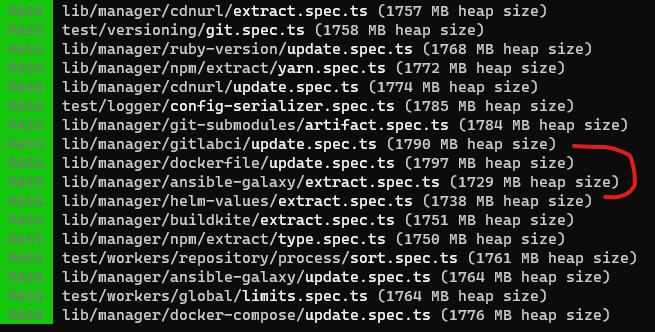
Are there any tests / subdirectories that don’t have 1700+ MB?

@viceice
Copy link
Member

viceice commented Feb 21, 2020

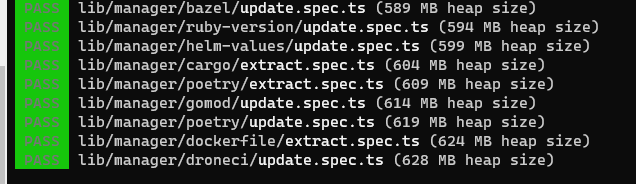
yes, if i only run manager
image

@rarkins
Copy link
Collaborator Author

rarkins commented Feb 21, 2020

How would running other tests contribute to manager tests consuming more heap?

@viceice
Copy link
Member

viceice commented Feb 21, 2020

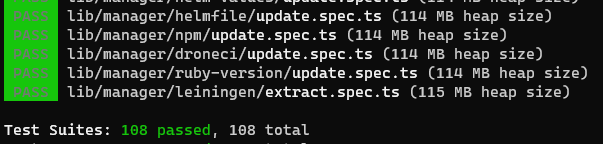
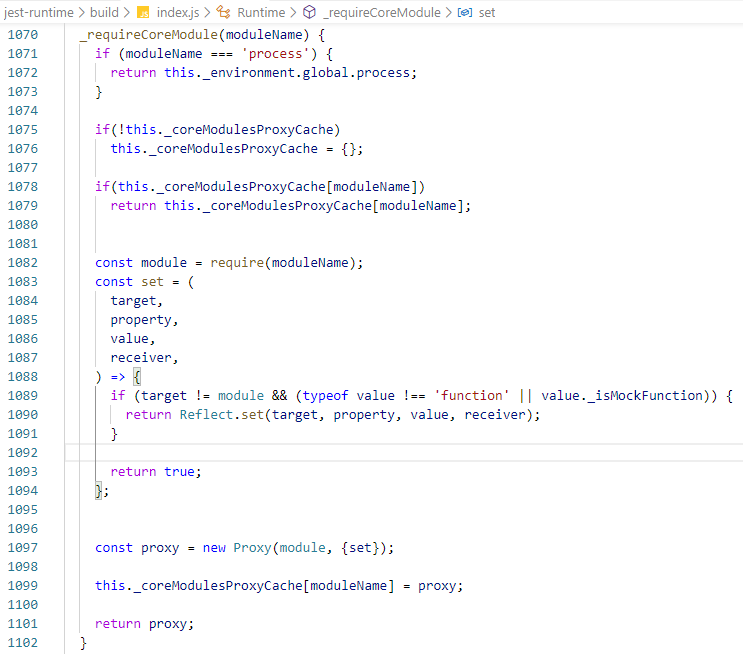
jestjs/jest#8331 fixes the problem

image

@viceice
Copy link
Member

viceice commented Feb 21, 2020

fix:
image

@github-actions
Copy link
Contributor

🎉 This issue has been resolved in version 19.144.1 🎉

The release is available on:

Your semantic-release bot 📦🚀

@github-actions github-actions bot locked as resolved and limited conversation to collaborators Dec 16, 2020
Sign up for free to subscribe to this conversation on GitHub. Already have an account? Sign in.
Labels
type:bug Bug fix of existing functionality
Projects
None yet
Development

Successfully merging a pull request may close this issue.

2 participants