Apache Pulsar Grafana dashboard is an open source visualization tool. It contains a unique Graphite target parser that enables easy metric and function editing. The Grafana dashboard is used to visualize time series data of different monitoring indexes.
To use Apache Pulsar Grafana Dashboard, you have to start Pulsar cluster and Prometheus first.
If you haven't installed Pulsar, you can start Pulsar standalone with one of the following methods:
If you have deployed Pulsar cluster, you can get a list of machines for each component.
Before running Prometheus, you have to download a Prometheus image file and generate a config file.
- Download a Prometheus image at Docker Hub, and install it.
- Generate a Prometheus config file. You can generate the config file with the following two options:
- Create a
standalone.prometheus.ymlfile in the/tmpdirectory, copy the contents of the standalone.prometheus.template.yml file to thestandalone.prometheus.ymlfile, and replace{{ STANDALONE_HOST }}with IP address of the machine running pulsar standalone. - Install j2cli. j2cli is a command-line tool for templating Jinja2 template files. You can use j2cli to generate a Prometheus config file from the standalone template.
$ STANDALONE_HOST="$(ifconfig | grep "inet " | grep -v 127.0.0.1 | awk '{ print $2 }')" j2 prometheus/standalone.yml.template > /tmp/standalone.prometheus.yml- Run Prometheus with the generated Prometheus config file.
docker run -p 9090:9090 -v /tmp/standalone.prometheus.yml:/etc/prometheus/prometheus.yml prom/prometheusIn the prometheus/standalone.yml.template template file, the default cluster name is set to standalone. If you are running Pulsar cluster, you need to configure your Prometheus server to collect the metrics of a Pulsar cluster. For details on configuration, refer to example prometheus config.
-
Configure Prometheus service, and make sure your Prometheus service attaches an extra label
clusterto the metrics collected from Pulsar cluster. The cluster name is aligned with thePULSAR_CLUSTERname you have provided to the grafana dashboard.global: ... external_labels: cluster: <your-cluster-name>
-
Make sure the job name of each component is the same with the ones in this dashboard.
- job proxy: the machines that run Pulsar proxies.
- job broker: the machines that run Pulsar brokers.
- job bookie: the machines that run bookies.
- job zookeeper: the machines that run zookeeper.
- job node_metrics: all the machines of the Pulsar cluster.
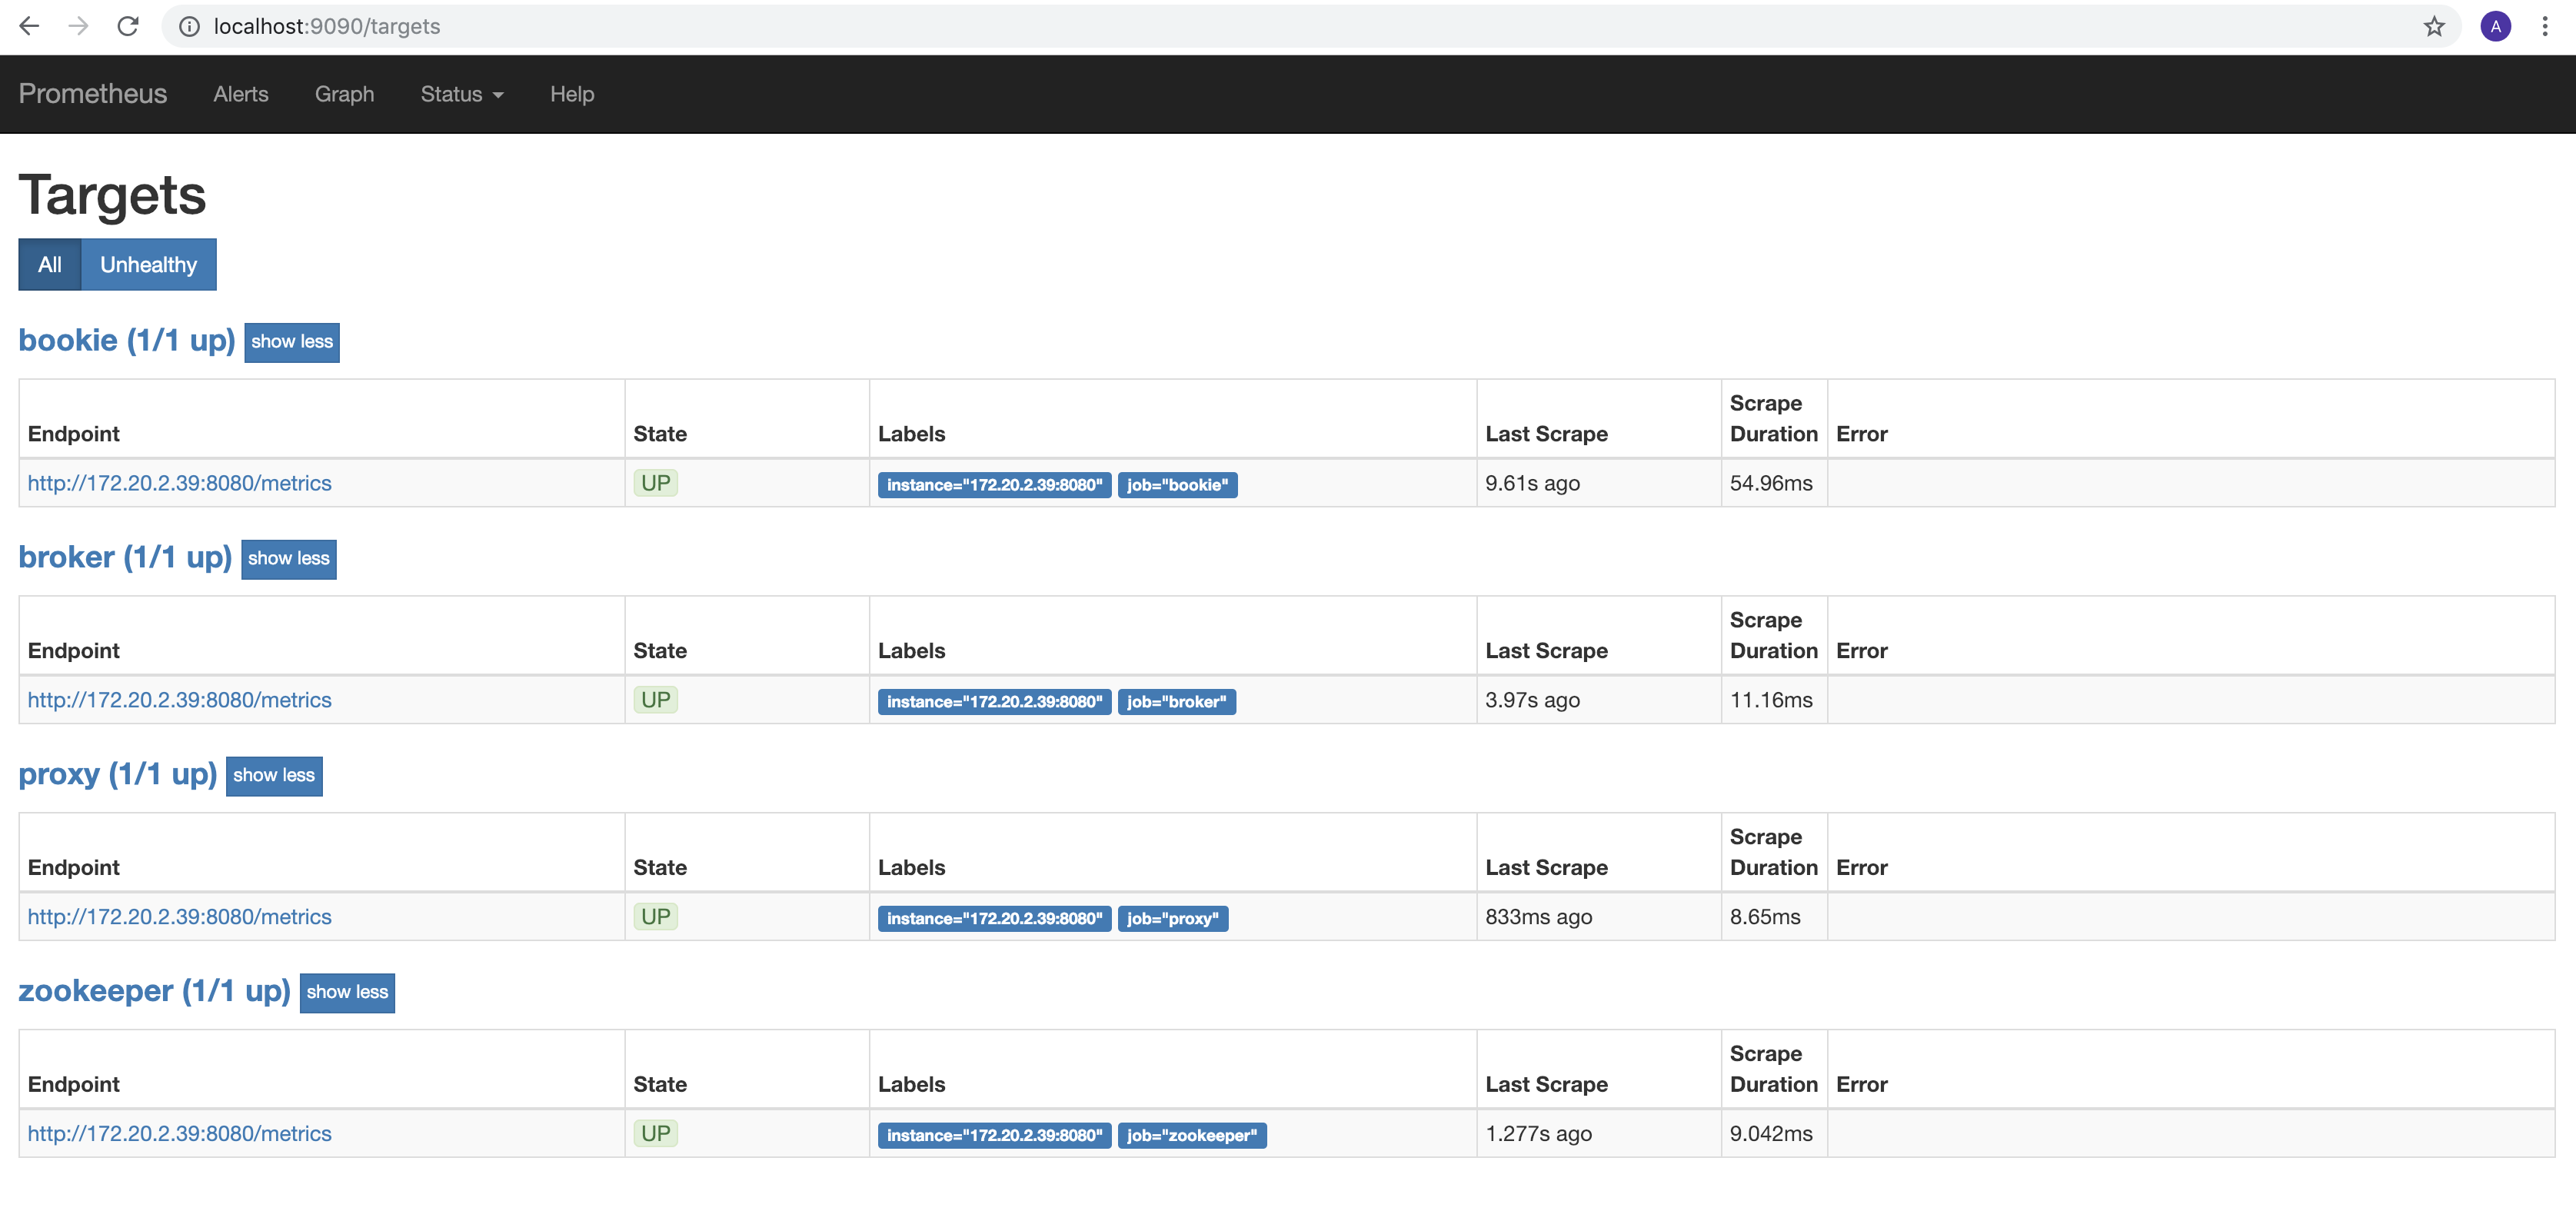
After running the Prometheus successfully, you have access to http://localhost:9090/targets, where you can see Prometheus detecting all Pulsar components, shown as follows.
When you have a Pulsar cluster and a Prometheus server connecting to the Pulsar cluster, you can start Grafana Dashboard.
- Download the Grafana dashboard docker image at Docker Hub, and issue the following command in docker.
docker pull streamnative/apache-pulsar-grafana-dashboard
- Configure the following two environment variables in docker.
- PULSAR_PROMETHEUS_URL: The HTTP URL that points to your Prometheus service. For example,
docker run -e PULSAR_PROMETHEUS_URL=http://<prometheus-host>:9090 <IMAGE ID>. - PULSAR_CLUSTER: The Pulsar cluster name. The cluster name is aligned with your Prometheus configuration. For example,
export PULSAR_CLUSTER=<your-cluster-name>.
The following is a command sample.
export PULSAR_PROMETHEUS_URL=http://$(ifconfig | grep "inet " | grep -v 127.0.0.1 | awk '{ print $2 }'):9090
export PULSAR_CLUSTER=standalone
docker run -it -p 3000:3000 -e PULSAR_PROMETHEUS_URL="${PULSAR_PROMETHEUS_URL}" -e PULSAR_CLUSTER="${PULSAR_CLUSTER}" streamnative/apache-pulsar-grafana-dashboard:latest
In this sample, you can access the Grafana Dashboard at http://localhost:3000.
The default user name and password are admin and happypulsaring. You can set the user name and password in the conf/grafana.ini file.
The Grafana Docker Image contains the following built-in dashboards for different components in an Apache Pulsar cluster.
- Overview: This renders the overview health of a Pulsar cluster.
- Messaging Metrics: This renders the metrics related to Pulsar messaging (e.g. producers, consumers, msg backlog and so on).
- Proxy Metrics: This renders the metrics related to Pulsar proxies if you have run proxies in your Pulsar clusters. This doesn't apply to a standalone cluster.
- Bookie Metrics: This renders the metrics related to Bookies. This doesn't apply to a Standalone cluster since a Pulsar standalone doesn't expose bookie metrics.
- ZooKeeper: This renders the metrics related to ZooKeeper cluster.
- JVM Metrics: This renders the jvm related metrics of all the components in a Pulsar cluster (For example, proxies, brokers, bookies, and so on).
System metrics are rendered in the Node Metrics dashboard and some portions in Overview dashboard. The system metrics used by these dashboards are collected by Prometheus Node Exporter. So you have to configure each Pulsar machine to run node exporter, and configure your Prometheus to scrape the metrics from node exporters.
To customize and build your own dashboard image, issue the following command:
makeCheckout Makefile for the details of the command used for building the docker image.