Discussion: Performance testing #2434
Comments
|
Thanks a lot, @Lakitna ! This is all valuable insides, learned a lot from just reading this issue 😍 Dropping downI haven't done a lot of thinking on "dropping down" with performance testing tools. I'm not sure how much value that would give us. For example, if the performance of inserting mutants in the code decreases by a factor of 2, this wouldn't have a big impact on running Stryker, because running tests take up > 95% of the time spend on mutation testing. However, a performance degradation that is known is always better than one that is not known, and it might be an undesired side effect of a change.
I think the current plugin structure provides a nice, hard cut between separate parts. I can think of 2 places on the top of my head. (note: we can still drop down deeper of course, but I'm not sure how useful that would be)
Stay up high
We currently use execa together with It currently provides output like this: I would be happy to improve this output with a benchmark tool of some sort. I also would like to see the output in the form of the clear-text table for example (right now, all mutants might error and we wouldn't even know). Continuous performance testingCurrently, I've configured the performance test workflow to be able to run on command with the new
I think this is fine to start with. When a pull request changes something significant, we'll trigger the workflow before approving as part of the review. We can think of better ways to do this in the future.
I think this should be the list:
|

Dropping down
I really like doing this, because it will make the high-level perf tests a lot simpler. The impact on runtime can be traced back to 4 factors:
Removing factors from consideration in high-level tests will speed up performance testing tremendously. It would also allow us to easily distinguish between runner issues and mutation issues.
I don't think we should do this one at a lower level. I think this one makes a lot more sense in a high-level setting. The reason for this is that high-level stuff tends to be more real-world when compared to lower-level stuff. Also, we only have to do once per test run (thanks to mutation switching). Therefore I would not care as much about the performance of this one. Pretty fast is probably good enough. And we can get a sense of its speed in high-level perf tests. Stay up high
Yeah, I would suggest putting things in an existing benchmark tool so we can make use of their stability and reporting abilities. Other than that, I don't think things will be much different. Asserting that the runs end with an expected mutation coverage feels like a good idea. Though we don't even need the That being said, we found that I had a lot more timeouts that you did in the Express bench. We might have to assert timeouts too. For that, you would need a reporter. Continuous performance testingWe can start with the current pipeline. But I strongly suggest adding a trigger to every PR at some point. Performance is very important in Stryker so it should always be visible for everyone.
If we drop down for the test runners (as above) we can condense this list:
This would give some redundancy in Typescript instrumentation. But Angular and React are both popular, so I see value in adding them both. This also gives us CLI and web projects. We also cover the most popular runners (Mocha, Karma, & Jest respectively). Finally, we should make sure we vary the benchmarks in size (mutation count & test count). As you can see, in these high-level tests we start combining variables. This is why it can be difficult to trace issues you find in high-level tests. |
|
I think we should continue our talk here @Lakitna (#2618) But going back: Latikna I have prepared some scenarios for testing: Code of example scenario: const scenarioUniformlyDistributed = (size: number, distribution: number) => {
for (let i = 0; i < size; i += distribution) {
const filename = UID();
saveToSrc(filename, createSourceFile(distribution));
saveToTest(filename, createTestFile(distribution));
}
};And it could be now executed in git actions or other CI tool for different values to create source and test files which later on can be mutated by stryker. The only problem I see for now is how to collect data. For now I only think of doing it by hand, I dunno other way, any suggestion / feedback is welcome. |
|
Ok, I think I have finally done it XD (github will hate me for using they VMs like this :D 16 runs GOOOO!) |
|
Results (first check, might need more points):
UniformlyDistributed (mutants amount - 10000)
RandomlyDistributed (mutants amount - 10000)
Thoughts for now: I do need more tests - to get more dots AND (more important) check if it is stable or i just randomly got big numbers (see 20000 in AllInOneFile). |


I think the second Anyway, I did a little bit of Google Sheets magic for this. Should make the results easier to process. It's in the same document as the Express and Lighthouse bench. See the last tab here https://docs.google.com/spreadsheets/d/11dqDoxqbXVCQiBVtMq_eZpgMljTMPL-voI1MQdA-gDA/edit#gid=448418706 You can simply add new results on the left, and the three charts will update automatically.
I think we'll need more data points for any meaningful conclusions. Especially for the randomly distributed one. |

yea, I was doing it by hand :P (also added more tests, waiting for them to complete now :) [probably will take round 6h 😅 ), see: https://github.com/kmdrGroch/Stryker-performance-testing/runs/1479699022 |
|
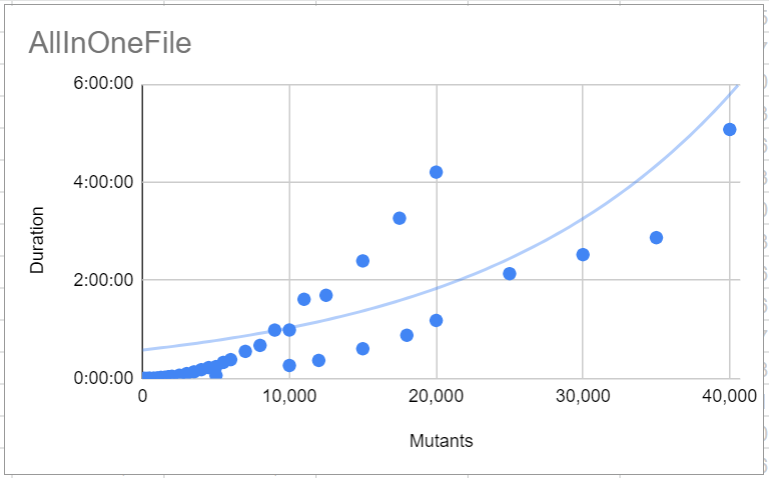
Ok, tests have been done: AllInOneFIle scenario:
Observations:
Possible reasons:
Possible solutions:
UniformlyDistributed
Observations:
RandomlyDistributed
Observations:
General observations
If you have any other observations / conclussions, ideas for other scenarios please share them :) |


|
Ooohh there are some really interesting trends here! I'd like to have some more data points to even out the noise. Can you trigger the same runs again? I'll process the results this time 😉 Just let me know which time metric you've used. AllInOneFile
The big jumps might just be noise. This is one of the reasons I'd like to run again. More data points should reduce the amount of noise.
One of the first things I did after looking at the graphs was to add a new graph:
Mutations per second is basically a metric of mutant processing speed. It's an interesting one, but I think we don't have enough data points between 100 and 10000 mutations. It looks to be a reverse exponential relation though. Which makes sense.
Indeed, we do not. I mentioned before that I suspect RAM to be the bottleneck. Do we want to validate that?
It's actually less than that, the fastest is 1000 mutants at 52.63 mutants/s. The slowest is 40000 mutants at 2.19mutants/s. A very significant difference. Should we investigate splitting mutants for big files (e.g. bundles)?
Probably a good starting point. It would be great if we can flatten the curve in the first graph. Though I think we can't make it linear due to hardware limitations. There will always be some bottleneck! UniformlyDistributedI really don't know about this one. The results feel very noisy, maybe more data will help. At this point, there are not a lot of conclusions we can make but one: More files = slower. Which makes sense, I/O takes time. @kmdrGroch I've added a chart, can you please check if I did things correctly? RandomlyDistributedThis looks to be a linear relationship (when We should be able to combine these results with the results of AllInOneFile. When combining this with the AllInOneFile tests we can almost certainly conclude that Stryker scales exponentially with the size of the codebase. @kmdrGroch I've added a chart, can you please check if I did things correctly? |

|
Honestly I dont get Sheet3 and Sheet4. Do you have some time on Friday so we could make a meeting about these? I could also provide more info about package I have made and give you access there. (we could add more scenarios then ;). It would be also nice to somehow process data automatically. Maybe some scrapper with python? [GitHub will hate me for running 24h tests and then scrapping them hahahaha 😅 ).
Yop I can add more data points. But it will take most likely about 10-20h to run 😅 (last one ran for 8h) build_and_test (14.x, all 50) - 1 file - 100 mutants. Basically number x 2 = mutants (with this function. We can change function tho) and about time i take: I take time from "Build & test" - i open it, scroll down to the bottom and read numbers from there
Also important note: If you want to clone and contribute - remember to cancel previous jobs - otherwise you will wait years for them to complete (for now we have 39 tasks and we want to add more [probably around 30 per scenario :P]) |


|
https://github.com/kmdrGroch/Stryker-performance-testing/runs/1487159798 |
Haha, I don't blame you, I was trying some stuff in Sheet3. I was trying to estimate the sweet spot for mutations per file. Didn't work very well though o.0 I used Sheet4 to get statistics on mutants per file in the Lighthouse bench. The bench has an average of 54.8 mutants per file. |
|
I also started working on this scraper but i somehow cant get the results :P I am stuck in opening tests and getting time 😓 but at least i get all cases for now and open them (so im VERY CLOSE to automate it [it takes ~10 * number of tests seconds [so in 13 minutes you can get all tests :D). Update: I dont think it is possible to scrape github from these values :c I guess to automate this we would need to either somehow get better knowledge of their API or get another type of script - they dont allow me to open "build_and_test" tab :/ |
|
@nicojs do we store execution time somewhere? Maybe i could create artifacts and get data from there 🤔 Ok I think I managed to create it. https://github.com/kmdrGroch/Stryker-performance-testing/actions/runs/396555042 |
|
Isn't there a csv or json reporter? I seem to remember such a thing existing. |
|
I just did "Stryker run > result.txt"
…On Wed, 2 Dec 2020, 18:50 Sander van Beek, ***@***.***> wrote:
Isn't there a csv or json reporter? I seem to remember such a thing
existing.
—
You are receiving this because you were mentioned.
Reply to this email directly, view it on GitHub
<#2434 (comment)>,
or unsubscribe
<https://github.com/notifications/unsubscribe-auth/AGZLQLWSMTXMZHNBLLHRG5LSSZ44XANCNFSM4QOAOBDQ>
.
|
|
I checked. There is a |
|
data can be also collected from artifacts now :) : https://github.com/kmdrGroch/Stryker-performance-testing/actions/runs/396555042 I have made simple tool for extraction and a lil of handling of data package.zip already cleaned up data: |
|
Awesome, that makes processing the data sooo much easier! Did you change anything to the |
|
i am scared that github uses different VMs or that runs depend on number of runs etc. |
|
Yeah, I don't see any differences in the other things. Does the x2 also apply to Edit: It looks like that solved it :) |
All in one file
Just look at those tight trendlines! :) I think it's pretty safe to say that there is some sort of exponential growth going on here. I do wonder about the 20000-30000 range though. The last graph is also pretty neat I think. You can clearly see that < 1000 mutants file operations are the bottleneck while > 1000 mutants the mutation testing is. I would like to find the formula for the trend line here. I think we could use that for some interesting stuff. I've tried, but not yet succeded. Uniformly distributed
Look at that, we can clearly see a linear relation between file count and execution time (when mutation count remains the same). Both graphs actually tell us the same thing as file count and mutations per file have an exponental relation. This result is underlined by the next one too Randomly distributed
Again, the linear relation between file count and execution time. This is basically the exact same result as the uniformly distributed one. Which makes sense to me. File operations are the deciding factor here. ConclusionI think it's safe to say that the relation between file count and runtime is a linear one. That is awesome. For the next step we could see if we can make a general definition for this relation. Only if we find it useful though, I'm not sure yet if I think that to be useful. The biggest realisation to me here is that there should be no huge performance difference between a source code bundle and source code files. Just a linear increase based on the file count. We might want to validate this and include this tip for large codebases in the docs. The relation between mutation count and runtime is an exponential one. If we want to improve performance we should focus our efforts on this relation. This also highlights why random mutation sampling #2584 is so much faster. |


I had test cases for these too, but github had max 6hours to timeout and all of these timed out 😅
I think it would be, if we knew +- the corelations and speed, we could better estimate time for tests to end ;) e.x my bigmath app gets info that it would be tested in e.x 4-5minutes in the beginning but ends up with 7-8 coz of drops etc :) we could give better time info + we find bottlenecks, and room to improve, test again, and check if correlations are still the same ;) What bothers me, is that we have exponential growth for mutants... I wonder why is that, and thinking how could we make it more of polynomial. We would somehow need to find bottleneck of it. Maybe some n^3 functions on top of mutants. We should also check all "filter", "map" and other functions on mutants, since they create new arrays which could increase ram usage, add some unnecessary stuff... especially if you run filter.filter.map instead of doing everything in one loop. If you are able to like run ~20000 mutants in a performance test to get what uses how much processing, it would probably help us. I think using simple functions like i used here would help us more - giving cleaner results, than using "random" ones (like express). If might also be that bottleneck is Babel/test tools. It would be pain then :) |
|
I reached the end of Sheets capabilities, so I stepped up to a more powerful program. You can see everything here in glorious interactive mode and such! https://public.tableau.com/profile/lakitna#!/vizhome/Strykerp/Dashboard The data has also been moved. I needed a cleaner data source. I used a new Sheets for that: https://docs.google.com/spreadsheets/d/1EhMUTFGiXkRK7giGinK6J_yzkjnyTmxVSl4u9OTDTK4/edit?usp=sharing Big improvements are in the ease of creating visualisations and trend lines. It also includes uncertainty bands on trend lines. It also allows us to select only a few runs, and see what it does on the other graphs. It's awesome! I have a lot more faith in these visualisations as there is a lot less room for errors. I did find out that the mutation count isn't quite exponential, but it's definitely the most important factor. Let me know what you think :) |
Yeah, I can do that. We won't be able to use the data point in the statistics, but it might help with tracking down what's causing the relationship to be exponential-ish. I might be able to do this tonight, but no promises! Edit: Thinking about predicting better runtimes. Can you include the duration of the initial test run in the scraper? Initial test run duration + mutation count + file count might be enough to estimate very closely. If we can find the relation between those three we might be able to formulate some solid advice for users. Something like "Expected run to take 02:21:56. It looks like the bottleneck is the number of source files. Bundling your source code before testing could save you about 00:32:03". It might be overkill though 👼 |
|
Yea, i was also checking our results, and indeed i found that growth is more likely to be polynomial (much better R^2 with our graphs), tho unfortunatelly in both cases these equations are soo ugly
Yeaa I believe so, i could try adding it tomorrow I think it was mentioned in some other issue long time ago, but I was also thinking and i think it would be nice, if we could add anonymous reporting - PC spec / number of files / number of mutations / time / initial time. |

|
@Lakitna I think no chance for 50000/60000 mutants... actions keeps cancelling them :c |
|
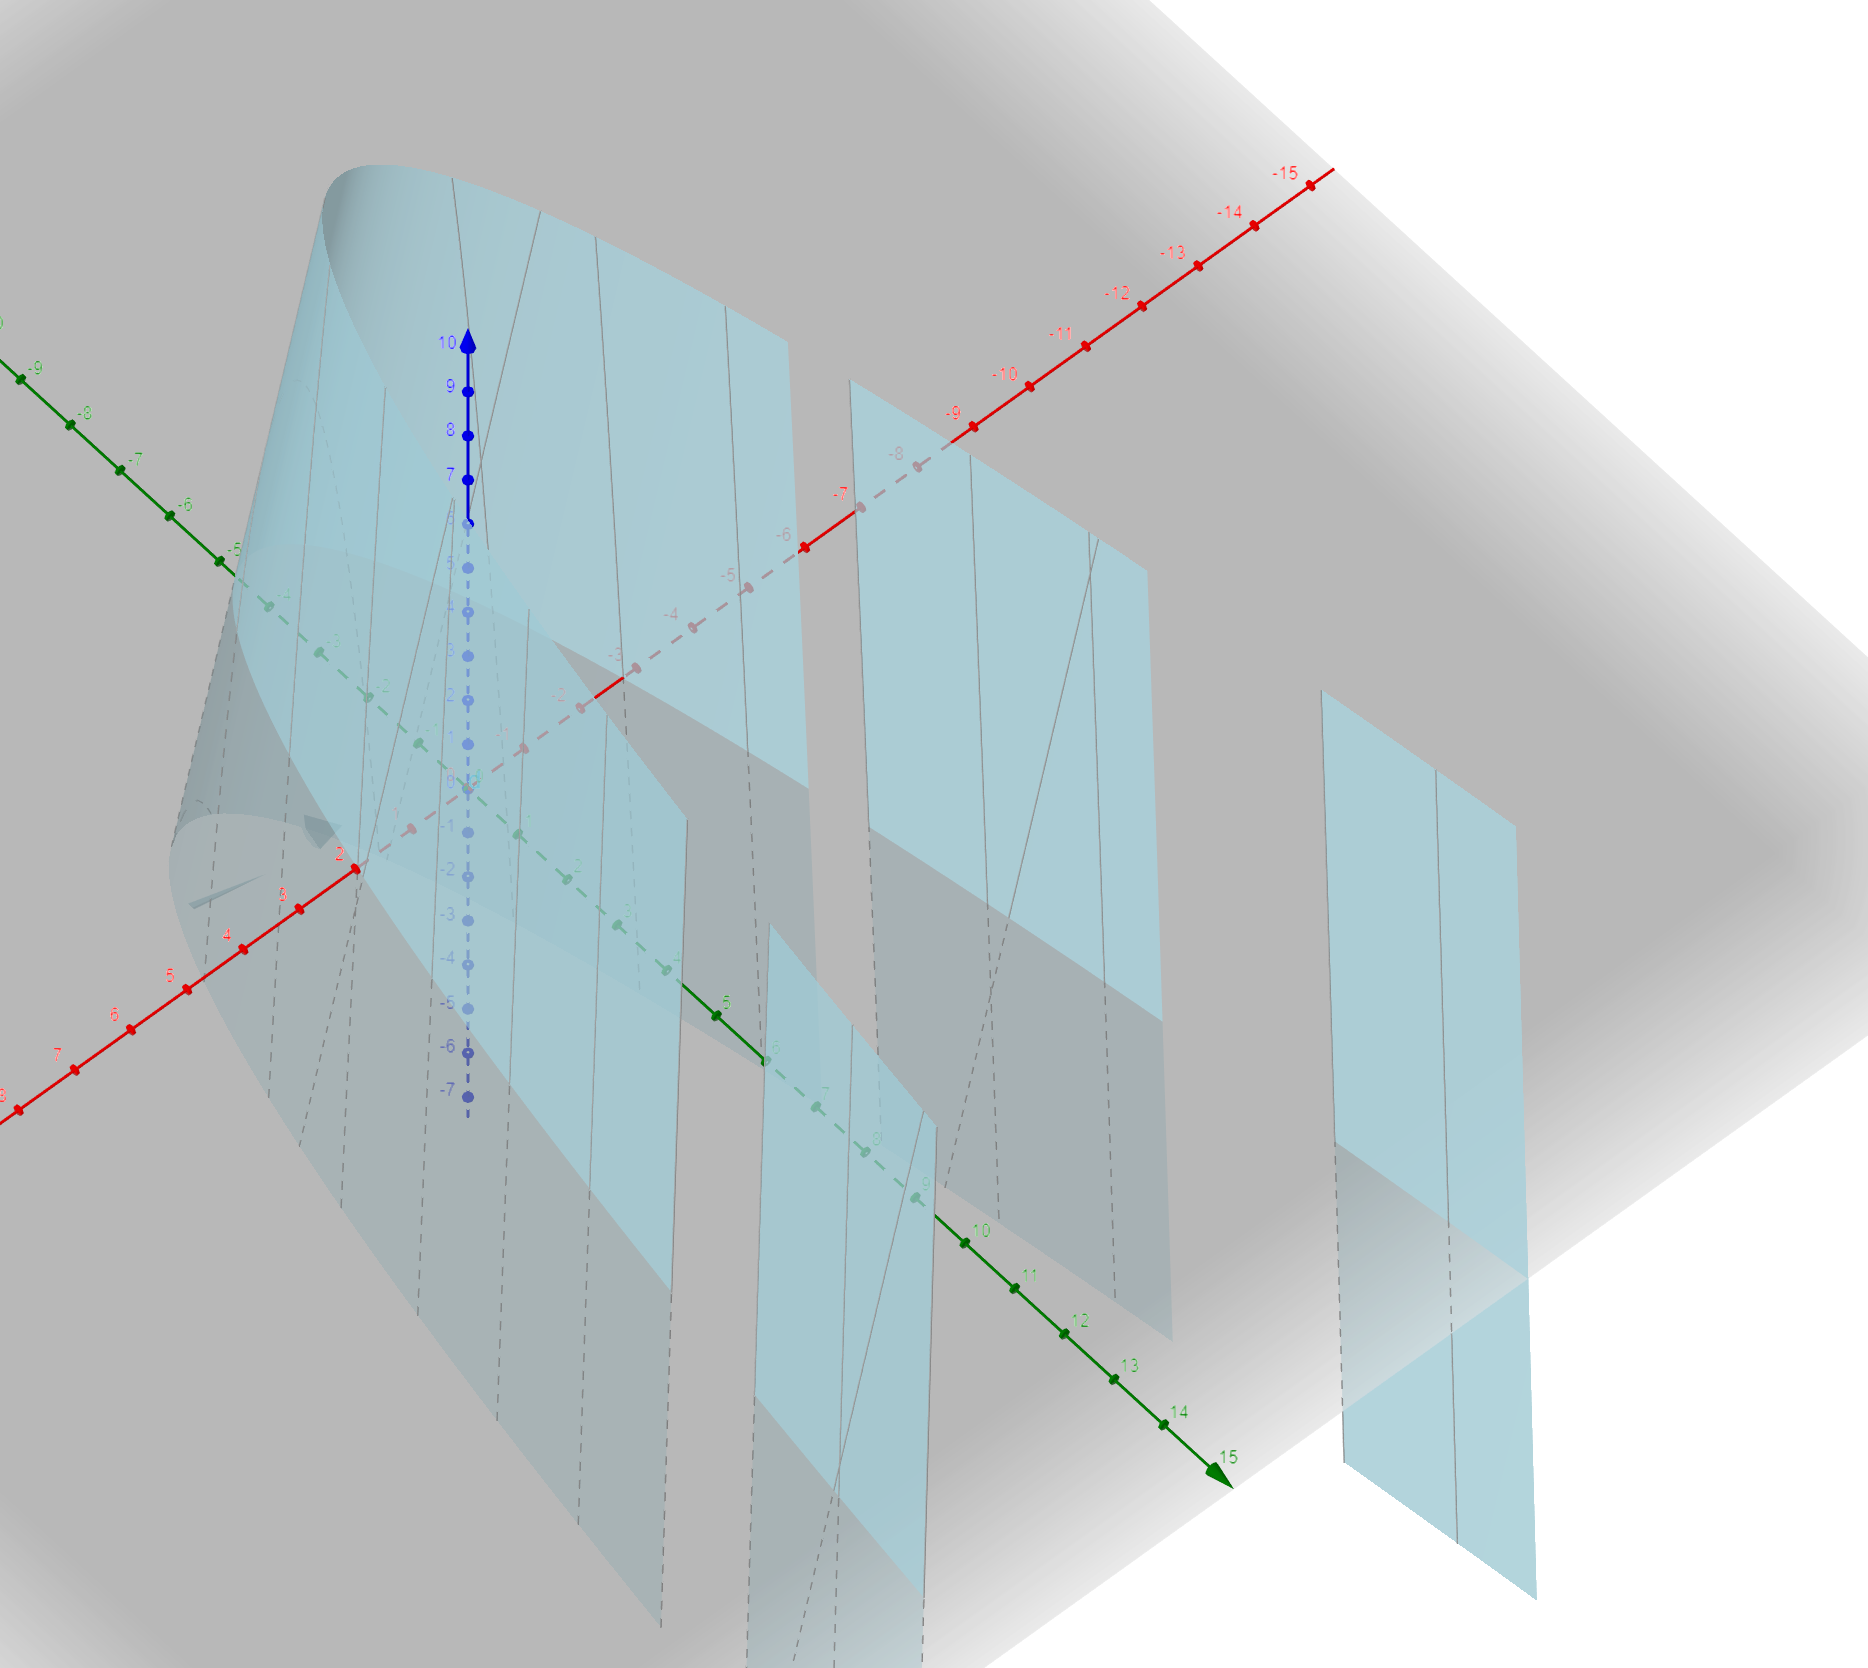
I've actually tried to made a 2d prediction just now: Mutation trend line: Files (random) trend line: I basically took the trendline for the mutation count and added to that the vector of the file trend to it. The Let's throw some maths at it to simplify it: I've even plotted the function: image According to Wolfram Alpha it's a parabolic cylinder if anyone is interested. |
|
@kmdrGroch I don't think it matters too much. The trendlines fit very well, I would be amazed if anything weird happens in higher numbers. I might be able to do it on my machine though, I'll take a look while I'm at it. |
then you need to compare it to all other tests as well :/
interesting O.O Is it like in minutes or seconds?
i tried running for t(40000, 1) but it doesnt match our results 🤔 |
|
It outputs seconds. I've tried it with a bunch of combinations. But now that I think about it, I didn't check > 12000 |
|
Oh wow, I really messed up the formula rewrite o.0 Try this instead :) |
|
I decided to do a full sweep of the The trendline currently has During the runs, I ran between 50 and 100000 mutations in various increments. It failed at 60000 due to |
this is still not accurate... I believe that there might be |
|
Meh you're right. I didn't check my work well enough it seems...
% difference between projection and actual plotted over actual times. All values should hover around a diff of 0%. |


|
So I was looking a bit deeper. To see if I can find out why my projection is so bad. Plotted here is files (x) vs runtime (y). Can you think of any reason why these lines are soo different? Did I mess up some data somewhere, or is uniform (orange square) just that much slower? I expect these trends to be somewhat similar, though random (red plus) should be a bit more erratic.
|

|
I feel like you multiplied something again... I should make my results more clear i suppose... build_and_test (14.x, all 50) - 1 file - 100 mutants @Lakitna maybe you want some meeting during weekend? we could talk it through instead of writing. I believe it would be much easier to get conclussions and like solve some ambiguities |
|
I tend to need my downtime during the weekend, but I can meet today? I see that you are a member of the Stryker Slack, we can use that to call. How about 11:00+01:00? I can also do 14:00+01:00 and anywhere after 16:00+01:00. |
|
So it looks like the reporting of the runs is tripping me up again. It starts to feel like a good idea to introduce a reporter for performance testing. One that outputs JSON. Something like: {
"timestamp": "2020-12-07T11:56Z", // optional
"score": 75.7,
"testPerMutant": 2.3,
"duration": {
"total": 1234,
"initialRun": 1,
"mutation": 1233
},
"mutants": {
"total": 12000,
"killed": 500,
"survived": 500,
"error": 100,
"timeout": 100,
"noCoverage": 0,
"ignored": 0
},
"files": {
"mutated": [
{
"path": "mutated/file/path.js",
"score": 12.32,
"testPerMutant": 2.3, // I don't think we have this data point?
"duration": 123, // I don't think we have this data point?
"mutants": {
"total": 12,
"killed": 5,
"survived": 5,
"error": 1,
"timeout": 1,
"noCoverage": 0,
"ignored": 0
}
},
{...}
],
"ignored": [ // optional
{
"path": "not/mutated/file/path.txt"
},
{...}
]
},
"stryker": {
"config": { // Parsed Stryker config
"testRunner": "mocha",
"coverageAnalysis": "perTest",
"concurrency": 15,
...
},
"version": "0.0.1",
}
}Basically, a reporter that outputs all kinds of interesting numbers we can use for performance/statistical analysis. As far as I'm concerned, it can be a separate NPM package. @nicojs @kmdrGroch What do you think? |
Thats oki 😆 I believe we could meet at 4pm :) (+1)
i would love it O.O I feel like, if we were also to remove Edit: unfortunatelly I wont be able to meet today, I have an important meeting today :/ |
That could be great. I feel like we would only have to remove the See updated output below. I used a quick MD5 hash for the file ID which not secure enough, I know. For {
"timestamp": "2020-12-07T11:56Z", // optional
"score": 75.7,
"testPerMutant": 2.3,
"tests": 2,
"duration": {
"total": 1234,
"initialRun": 1,
"mutation": 1233
},
"mutants": {
"total": 12000,
"killed": 500,
"survived": 500,
"error": 100,
"timeout": 100,
"noCoverage": 0,
"ignored": 0
},
"files": {
"mutated": [
{
"id": "d5886a034ba69e2ebdccb36e71cd6416",
"score": 12.32,
"testPerMutant": 2.3, // I don't think we have this data point?
"duration": 123, // I don't think we have this data point?
"mutants": {
"total": 12,
"killed": 5,
"survived": 5,
"error": 1,
"timeout": 1,
"noCoverage": 0,
"ignored": 0
}
},
{...}
],
"ignored": [ // optional
{
"id": "c03b77207e30c3e17df1dd604cb59e05" // Kind of useless now :)
},
{...}
]
},
"stryker": {
"version": "0.0.1",
"config": { // Parsed Stryker config
"testRunner": "mocha",
"coverageAnalysis": "perTest",
"concurrency": 15,
...
}
},
"system": {
"ci": false,
"os": {
"version": "Windows 10 Pro",
"platform": "win32",
"release": "10.0.19041"
},
"cpu": {
"model": "Intel(R) Core(TM) i9-9880H CPU @ 2.30GHz",
"logicalCores": 16,
"baseClock": 2304
},
"ram": {
"size": 34.07,
...
}
}
} |
|
I almost forgot to write an update on this: The failing test runs with ~60000 mutants. It turns out that this is due to the heap size limit during the typescript transpiling of the source file. Node processes have a default heap size limit that will be exceeded by This makes a lot of sense to me. I was able to fix the test by providing the Or, in other words, these tests fail due to a Node limitation, not a Stryker limitation. We can safely ignore this. |
|
@Lakitna so yeaa... I have totally forgotten about performance testing app :D It has already ran like 50 times https://github.com/kmdrGroch/Stryker-performance-testing/actions |
|
This issue has been automatically marked as stale because it has not had recent activity. It will be closed if no further activity occurs. Thank you for your contributions. |
I've been talking with @nicojs about performance testing Stryker to help prevent performance regression. We've talked about this in various issues. Let's bundle the discussion here.
Current performance tests
The current performance benchmarks are executed on a high level. In practical terms, this comes in the form of letting Stryker loose on various projects. At the time of writing the
/perffolder contains an Angular app, and I'm working on adding Express next to that #2417. As with any high-level test, this is not the fastest way of getting information. The baseline I executed for Express took about 8 minutes in Stryker@3.You may have noticed I called them 'performance benchmarks' just now. The current setup does not do any warmup or repetition. This makes it a 'performance benchmark' rather than a proper 'performance test'. The reason for this comes back to the current tests being not the fastest.
Potential ways forward
Dropping down
It is very much possible to execute performance tests on a lower level. We could even make it low level enough that Stryker can test the performance tests for mutations. Now that's dogfooding! We probably shouldn't do this though.
The biggest advantages of this are:
Biggest disadvantages:
This would bring is in the realm of tools like benchmark.js, nanobench, matcha, exectimer, etc. There are a lot of options here.
However, I do not know how well this would work in Stryker. I'm not familiar enough with the codebase. Are there semantically separate parts of Stryker that could be worth performance testing separately?
Stay up high
We could also stick with the high-level approach. We would basically keep simulating a user by copying in open source projects that give us a decent coverage of the type of projects Stryker can end up in.
The biggest advantages of this are:
Biggest disadvantages:
This would probably bring us in the realm of CLI-focussed tools. I've used some before, but I don't think there are any written in JavaScript. This would add tech stack complexity. We could also write something ourselves using tools like execa in combination with one of the tools mentioned before. This should not be a lot of work.
Continuous performance testing
Most people are familiar with things like coverage gates & regression warnings. This is also possible with performance.
We could use something like this Github action: https://github.com/rhysd/github-action-benchmark. This can provide us with warnings like this:
On a practical note, this requires the performance tests in CI to not take very long. Currently, the slowest pipeline seems to be E2E-windows with about 23 minutes. I suggest ensuring that the performance tests to not take any longer than the E2E tests.
When comparing runs you have to make sure that both runs have been completed in the same circumstances. Luckily, pipeline agents tend to be consistently specced.
Use cases
Stryker has multiple use cases, defined by the technology behind the projects. For example, the Express benchmark covers the use case: CommonJS without instrumentation & the Mocha test runner.
Other use cases include:
We should probably identify interesting use cases we want to test.
The text was updated successfully, but these errors were encountered: