A real-time chromatic music visualizer, based on ColorChord.NET. This implementation is written in SystemVerilog, intended for use with both Quartus and the DE1-SoC FPGA development board, as well as a Synopsys ASIC compilation flow targeting the TSMC 65nm process.
For NDA reasons, any ASIC-specific content has been omitted from the public repository.
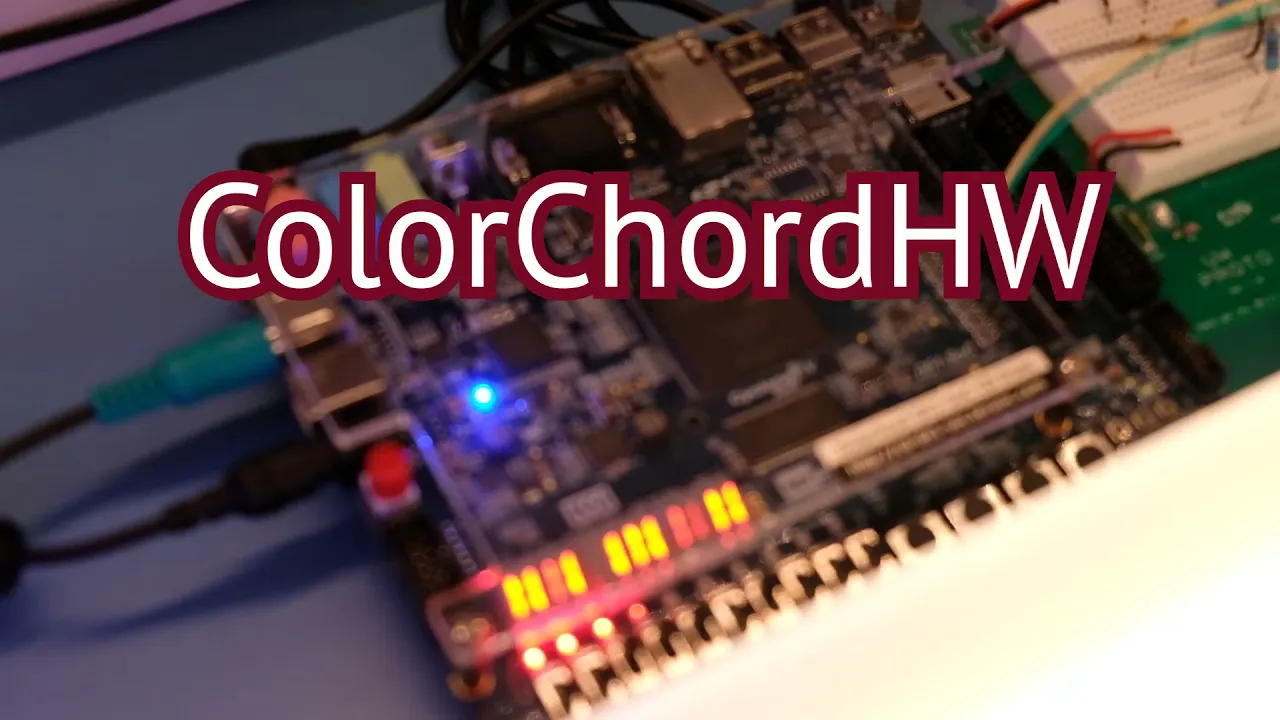
You can see a demo of the system in action here:
The system takes in signed 16-bit audio samples at a sample rate of 48KHz. These audio samples are processed by a custom music-optimized DFT to be converted to frequency-domain information, then passed to the NoteFinder to associate this to the chromatic scale and do smoothing, then the notes are passed to the Linear visualizer, which is meant to mimic the software implementation. Finally, LED data is serialized for use with a strip of 50 WS2801 RGB LEDs.
The system is highly customizable, with many options parameterized.
This module takes in 16-bit signed audio samples at 48KHz. It will take approximately 244 clock cycles to process 1 audio sample at the default 5 octaves, 24 bins each (= 120 bins). As such, to keep up with the audio samples, a clock of at least 12.5MHz is recommended.
The DFT requires sine and cosine data to be asynchronously provided via I/O ports. This data can be generated with the help of the other/GenerateTables.ps1 PowerShell script, which will place the tables in 16-bit signed hexadecimal format into other/costable.txt and other/sintable.txt. In addition, some other required values are output to the console by this script depending on various other parameters, such as RAM size. These are clearly denoted in comments contained in src/DFT.sv.
In order to test the DFT's functionality, a PowerShell script is used to generate 3 pieces of data: an input waveform, a set of expected output bin values, and code for a testbench using this data. The PowerShell script to generate these is located at other/GenerateDFTTestData.ps1. This creates other/dfttestdata.txt and src/Test_DFT.sv. The testbench can be run in ModelSim, with the provided .do file at sim/Test_DFT.do, or with VCS by using src/Test_DFT.sv as the top-level module.
Note that the PowerShell script calculates using high-precision floating point numbers and full squares and square root operations. The hardware uses integer math, and approximations for those operations, and as such the outputs will not match 1:1. For this reason, an Excel workbook, other/DFTOutputComparer.xlsx is provided to visually inspect the output against the test results. Simply copy-paste the last 120 lines of output from the testbench after execution finishes, and paste them into the indicated area in the Excel sheet. Use the 2 graphs to ensure the output matches the expected values with sufficient precision.
The NoteFinder takes the bin magnitude outputs from the DFT, and uses a 4-stage pipelined process spanning 240 clock cycles to smooth, detect peaks, position peaks, merge octaves, time-correlate, associate, and filter the data to generate a set of up to 12 notes. Some of the math involved in this process is quite intense, and would be a good target for further pipelining if the clock speed needed to be raised.
Just like the DFT, there is ample testing infrastructure in place. A PowerShell script, other/GenerateNFInputPeaks.ps1 creates a file other/nfpeaks.txt containing data to test the NoteFinder seperately. This data is a set of 2 peaks that moves through bins, and when the NoteFinder is working correctly, you should see 2 notes present on the output at all times, moving smoothly through the full range, then wrapping around at the ends as the inputs cross between octaves. To use this test, the testbench src/Test_NoteFinderWithData.sv is provided.
The Linear Visualizer combines the frequency and amplitude information, and maps it to the color spectrum with 8 bits for each of Red, Green, and Blue. The current implementation takes 12 structs of frequency and amplitude data (notes) and converts them into an array of 12 unique color values. In order to correctly be interpreted by the LED Driver, the Visualizer also has to organize and order each of the unique LED words as they should appear on a bar of LEDs.
Testing and configuration of the Linear Visualizer is backed by a series of scripts and an Excel sheet, along with the standard set of HDL testbenches. The Excel sheet, other/LinearVisualizer.xlsx, computes the predicted values of every net and register in the Visualizer as it would be computed using real hardware. This allows us to be able to predict what values are expected accurately, which is otherwise difficult because of the representation of floating point numbers in simulation software. sim/Test_LinearVisualizer.sv is the primary testbench for this system and tracks the major signals between the inner modules. other/GenerateVisualizerTestData.ps1 utilizes other/fixedPointCalculator.py to compute an array of note positions and amplitudes and generates binary values that will be used by the testbench. It produces two files, other/testNoteAmplitudes.mem and other/testNotePositions.mem which contain twelve 16-bit binary numbers than can quickly be pasted into the Excel sheet to predict output data. The Linear Visualizer was devloped first using software and is represented by the Python file other/LinearVisualizer.py which replicated the C# implementation but is simplified and modified for hardware.
The LED Driver's purpose is to interpret the color words and their orginization data and serialize colors in the correct order onto a data line. While this seems relatively simple, our LEDDriver computes the next colorword and bit as it is serializing it, meaning the system is always using the most recent data. This driver was built to work with the WS2801 driver chip, which is a 3 channel LED driver and produces the color word value on an RGB LED generated by the Linear Visualizer.
Testing the LED Driver is much simpler than the other systems because it is mathematically simple, however since the data is serialized it is not eay to read and its interaction with the WS2801 is a mystery. To overcome these issues the LED Driver was paired with an LED Model module with emulates the WS2801 and is able to output the actual colors captured by it. This interaction
is visible in the sim/Test_LEDDriver2.sv and expected values are compared to recieved values with the results printed to the terminal. It was also tested on real WS2801 LED drivers from an FPGA.
The full system can be tested, by first generating DFT input data as outlined in the DFT section above, but instead using the testbench at src/Test_FullSystem.sv. If using ModelSim, sim/Test_FullSystem.do is provided. It has also been tested in VCS.
-
The
DFT_DE1directory contains a Quartus project and top-level module for programming onto a DE1-SoC development kit with the full CCHW system. It uses the Audio codec to read audio data from the microphone, and outputs data to pins on the GPIO0 header. The HEX displays show currently active peaks, and LEDRs show input audio amplitude. -
The
otherdirectory contains a variety of helper scripts, which generate data, help debug, and carry out a variety of other tasks. Many are explained in the Verification section above. -
simcontains .do and waveform configuration files for simulating all parts of the design in ModelSim. -
srccontains all of the source code shared between both versions.src/FPGAcontains files specific to the FPGA implementation, such as the RAM and audio codec IPs.src/ASICcontains files specific to the ASIC implementation, all but 1 has been omitted from the public repository.src/*contains all of the SystemVerilog code and testbenches to implement CCHW.
Hierarchy Overview:
Common.sv: Library used by many other filesColorChordTop.svDFT.svTrigLUTs.sv- RAM IP specific to target (FPGA or ASIC)
NoteFinder.svFilter.sv
LinearVisualizer.svAmpPreprocessor.svHueCalc.svColorCalc.svLEDCountCalc.sv
LEDDriver2.sv
The remaining source files are used for testing & verification purposes, or are old versions no longer in use.