Query Performance Insights (QPI) is Azure Data Studio extension that enables you to monitor performance and troubleshoot performance issues using Query Performance Insights T-SQL library. This extension works with Azure SQL Managed Instance and the latest version of SQL Server.
Query Performance Insights library is a collection of useful scripts that enable you find what is happening with your SQL Server 2016+ or Azure SQL Database (Single or Managed Instance). This is a set of helper views, functions, and procedures that wrap Query Store and Dynamic Management Objects.
QPI Azure Data Studio extension is a user interface that enables you to easily install Query Performance Insights library in your database and see the most useful reports without need to write SQL queries.
Find Query Performance Insights extension in Azure Data studio and install the latest available version.
Database that you monitor and troubleshoot must have Query Performance Insights scripts.
If you are using Azure SQL Managed Instance or SQL Server 2019+, you can install the Query Performance Insights scripts directly using the extension. Find the database that you want to monitor in connections and use QPI: Install latest QPI scripts option. Run the query that is opened to add QPI objects in your database.
If you are using Azure SQL Database or SQL Server 2016-2017, find the version of the script in QPI installation section.
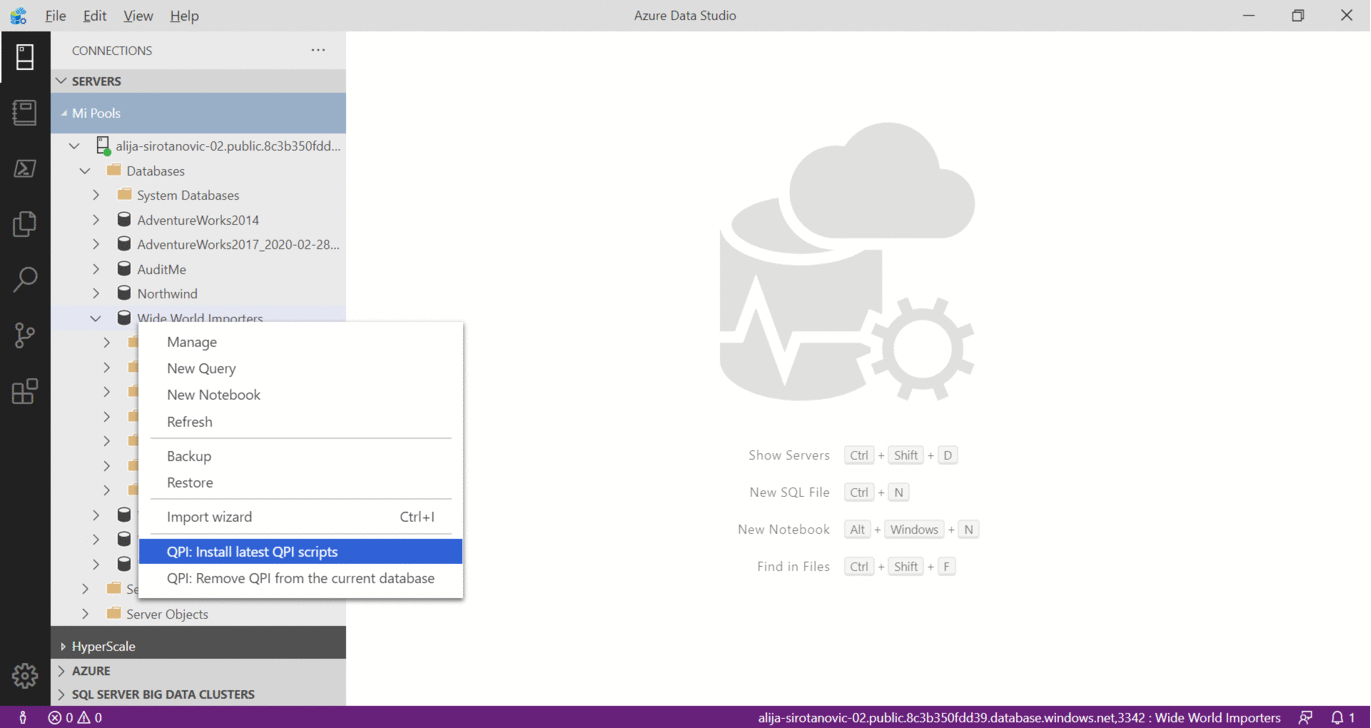
After installation, you will get the schema qpi in your database will the set of views, functions, and tables needed for performance troubleshooting. If you want to remove your QPI script from the database, right-click and use QPI: Remove QPI scripts option.
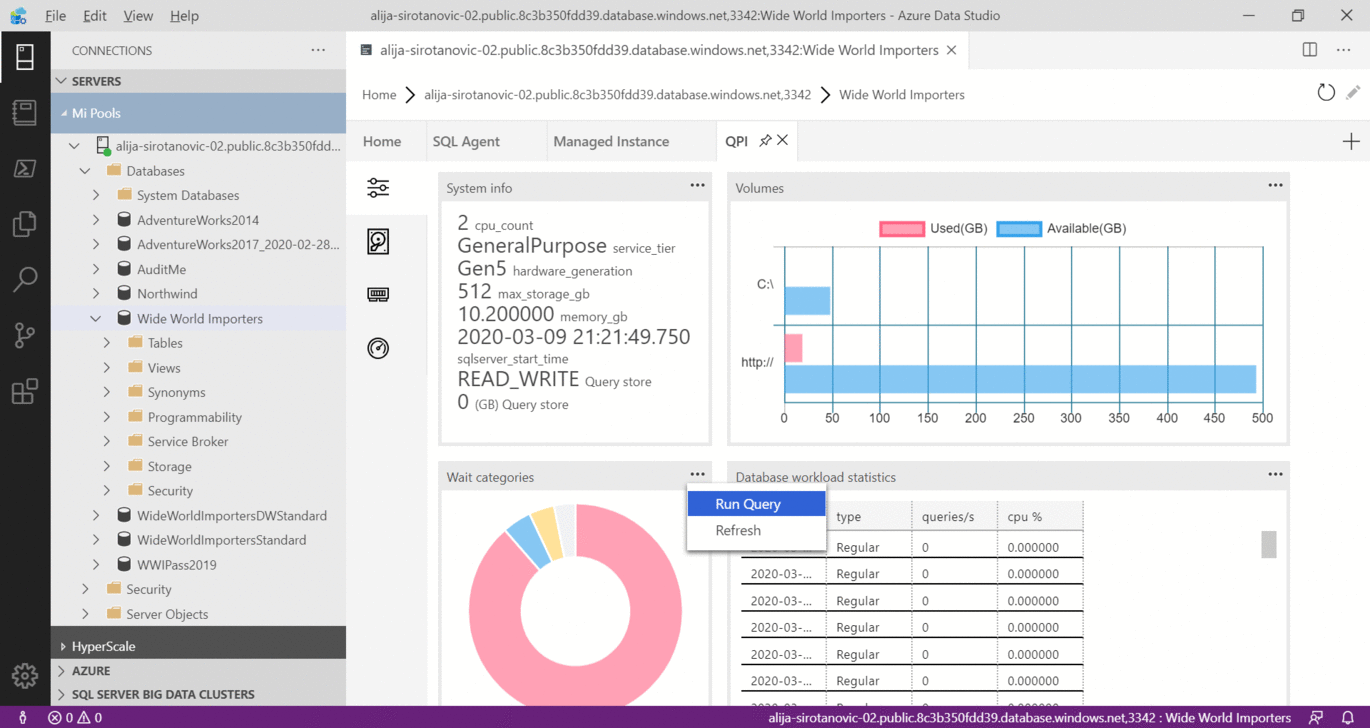
Select your database and open QPI tab. Here you can see a set of reports divided in the following sections:
- Properties
- File IO
- Memory
- Query statistics
If you see anything strange in the reports select right-upper corner of the report and select Run Query option. This option will open the underlying query used for report that you can modify.
There is a set of predefined snippets with qpi: prefix that will be expanded as useful queries that you can use for analysis.
Some metrics in database are cumulative and you need to take periodic snapshots of these metrics to have baseline for reports. The following metrics need baselines:
- File statistics
- Wait statistics
- Performance counters
You can open new query and use qpi:snapshot snippet to take a snapshot of all statistics mentioned above. You can also use qpi:snapshot file stats, qpi:snapshot wait stats, and qpi:snapshot perf counters to take the snapshot of specific statistic.
You can also create SQL Agent job that will periodically take snapshots of statistics. Right-click on the instance and select QPI: Install SQL Agent job that will periodically take the snapshots of statistics. In the query window set the name of database where statistic snapshots should be taken.
This extension is licensed under the MIT License.