Author: Romain Pastureau
find_delay is a Python package that tries to find the delay where a time series appears in another via cross-correlation. It can theoretically work with any time series (see the examples in the demos folder, but was created to try to align audio files. Read the documentation here!
The best way to use this function is to install the find_delay module for Python by running
py -m pip install find-delay.
You can then import the function by writing from find_delay import find_delay (or from find_delay import find_delays
if you want to locate multiple excerpts in one big time series).
You can also run demos/demo.py to get four examples (in that case, you will need to download the .wav files present in the repository and place them in the same folder for examples 3 and 4).
To find when an excerpt starts in an audio file, use the find_delay function and fill only the first four parameters;
leave the other parameters default (just set plot_figure = True if you want to visualize the output of the function).
The function accepts two arrays containing time series - the time series can be of different frequency or amplitude.
The function can then calculate the envelope of the time series (recommended for audio files) and apply a band-pass filter to the result.
The function can also resample the arrays (necessary when the two time series do not have the same frequency).
Finally, the function performs the cross-correlation between the two arrays.
The results can be then plotted if the corresponding parameters are activated, and the function returns the delay at which to find the second array in the first by selecting the delay with the maximum correlation value (optionally, the function can also return this correlation value).
- Matplotlib for the plots
- Numpy for handling the numerical arrays
- Scipy for loading the WAV files, performing the resampling, calculating the envelope, and applying a band-pass filter.
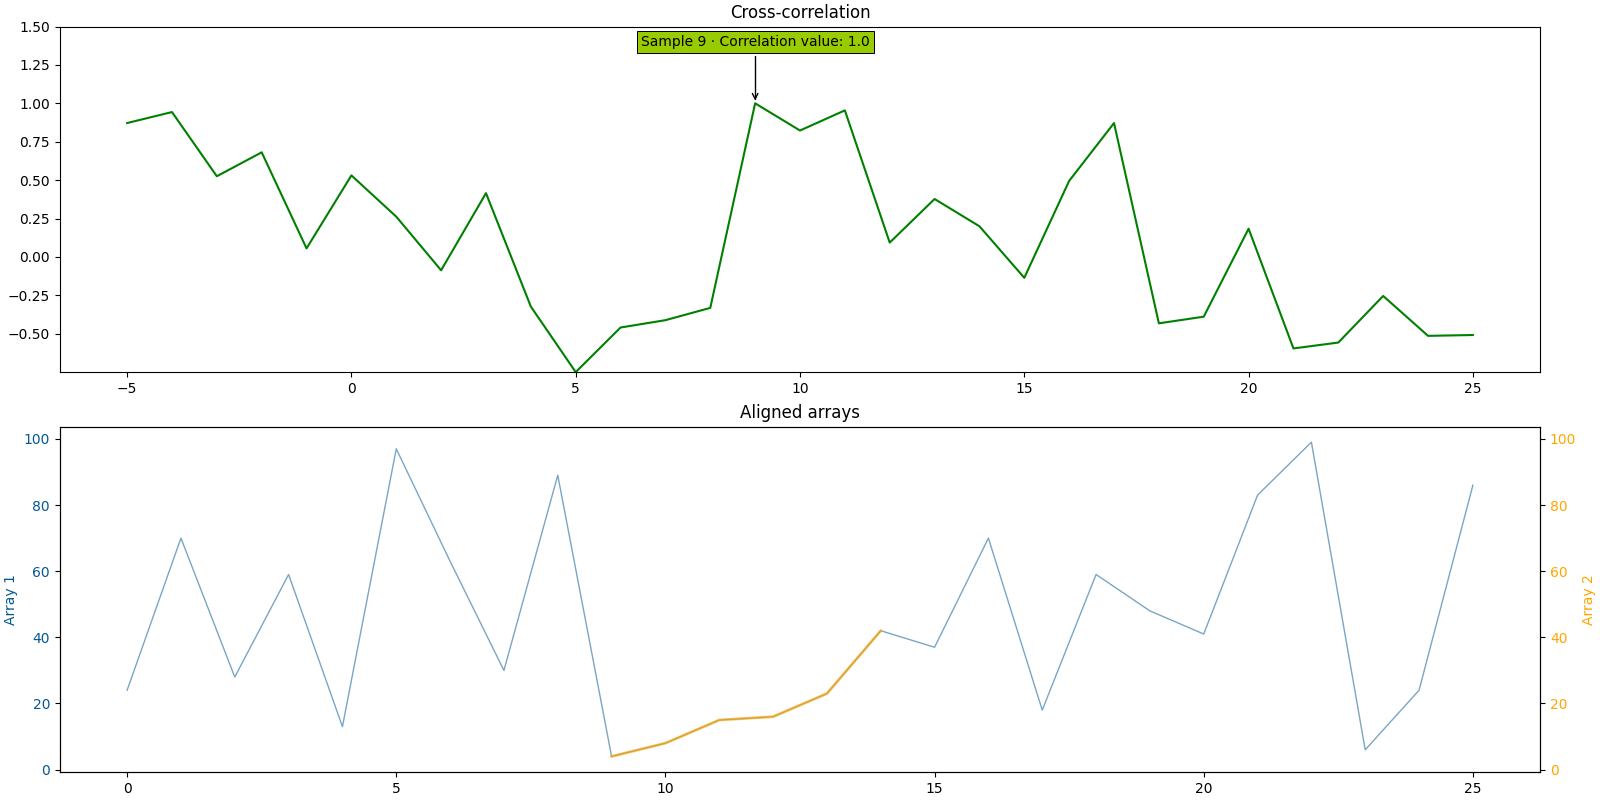
array_1 = [24, 70, 28, 59, 13, 97, 63, 30, 89, 4, 8, 15, 16, 23, 42, 37, 70, 18, 59, 48, 41, 83, 99, 6, 24, 86]
array_2 = [4, 8, 15, 16, 23, 42]

find_delay(array_1, array_2, compute_envelope=False, plot_figure=True, path_figure="figure_1.png")
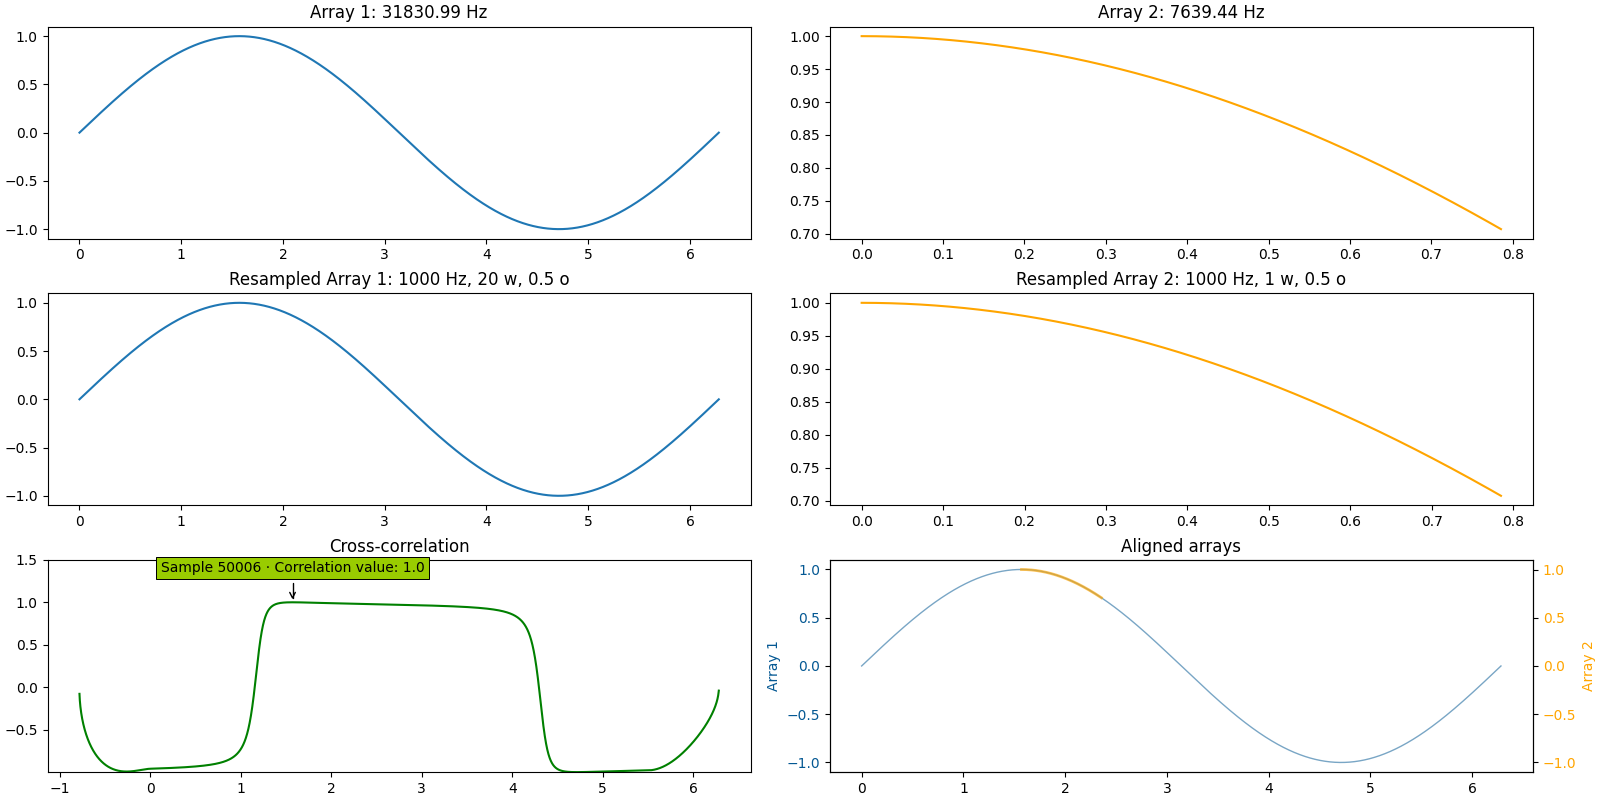
timestamps_1 = np.linspace(0, np.pi * 2, 200001)
array_1 = np.sin(timestamps_1)
timestamps_2 = np.linspace(np.pi * 0.5, np.pi * 0.75, 6001)
array_2 = np.sin(timestamps_2)

find_delay(array_1, array_2, 100000 / np.pi, 6000 / (np.pi / 4),
           compute_envelope=False, resampling_rate=1000, window_size_res=20000, overlap_ratio_res=0.5,
           resampling_mode="cubic", plot_figure=True, path_figure="figure_2.png", plot_intermediate_steps=True,
           verbosity=1)
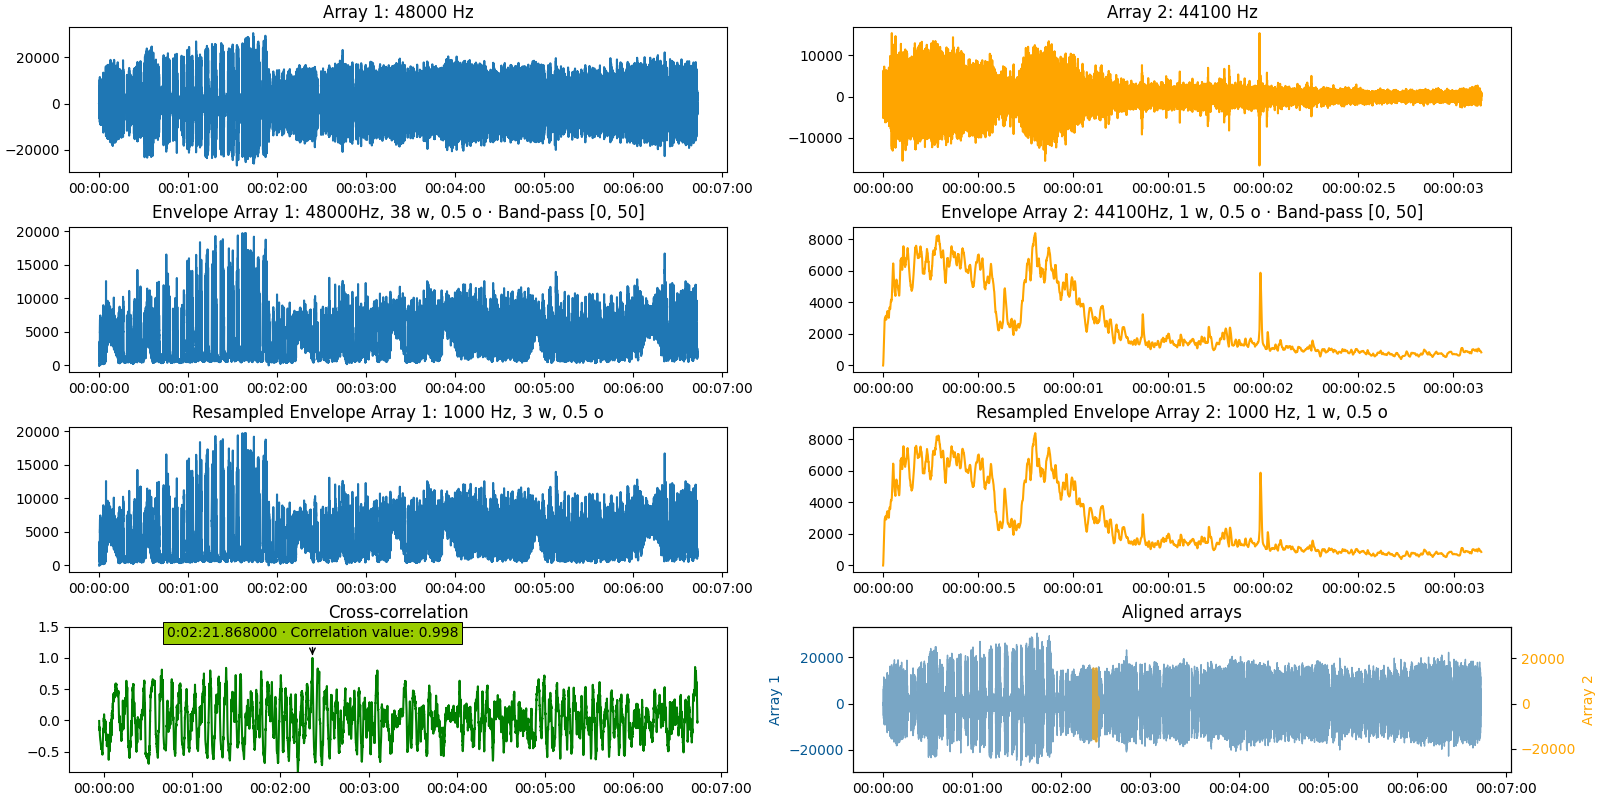
audio_path = "i_have_a_dream_full.wav"
audio_wav = wavfile.read(audio_path)
audio_frequency = audio_wav[0]
audio_array = audio_wav[1][:, 0]  # Turn to mono

excerpt_path = "i_have_a_dream_excerpt.wav"
excerpt_wav = wavfile.read(excerpt_path)
excerpt_frequency = excerpt_wav[0]
excerpt_array = excerpt_wav[1][:, 0]  # Turn to mono

find_delay(audio_array, excerpt_array, audio_frequency, excerpt_frequency,
           compute_envelope=True, window_size_env=1e6, overlap_ratio_env=0.5,
           resampling_rate=1000, window_size_res=1e7, overlap_ratio_res=0.5, return_delay_format="timedelta",
           resampling_mode="cubic", plot_figure=True, path_figure="figure_3.png", plot_intermediate_steps=True,
           verbosity=1)
2.7 (2024-05-09)
- Simplified
from find_delay.find_delay import find_delaytofrom find_delay import find_delay - Corrected scaling (again) on the aligned arrays graph
- Reestablished audio examples with downloadable WAV files when running the demo
- Added an example with randomly generated numbers
2.6 (2024-05-08)
- Removed demo audio files to lighten the Python package; they are still available on the main branch
2.5 (2024-05-08)
- Turned find_delay into a Python package, install with
py -m pip install find_delay
2.4 (2024-05-08)
- The functions now look for correlation at the edges of the first array, in the case where the second array contains information that starts before the beginning, or ends after the end of the first
- Example 4 has been updated with one new audio file to demonstrate this change
- Adding a parameter x_format_figure that allows to display HH:MM:SS time on the x-axis
- Corrected a bug in the percentage progressions that prevented to display all the steps
- Added "Quick use for audio files" segment in the README file
2.3 (2024-05-02)
- Corrected a bug that prevented the figures to be saved as a file
- Plotting without intermediate steps now plots the graphs on top of each other, not side-by-side
2.2 (2024-05-02)
- "i_have_a_dream_excerpt2.wav" is now of lower amplitude to test the scaling on the graph overlay
- Arrays with different amplitudes now appear scaled on the graph overlay
- Excerpt numbers now start at 1 instead of 0 on the graphs in find_delays
2.1 (2024-04-25)
- Modified the overall functions so that they take a window size instead of a number of windows
2.0 (2024-04-24)
- Changed the parameter asking for a number of windows by a parameter asking for a window size instead
- Clarified the docstrings in the documentation of the functions
- Modified
find_delaysso that saving the figures would iterate the filenames instead of overwriting - Modified
_get_envelopeand_resampleso that a number of windows inferior to 1 would be set at 1 - Added documentation for
_create_figureand simplified unused parameters - Corrected broken figure saving
- Added figure saving for the 3 first examples
1.3 (2024-04-18)
- Removed unused function
_get_number_of_windows
1.2 (2024-04-17)
- Added transparency of the second (orange) array on the graph overlay
- Clarified README.md and added figures
1.1 (2024-04-16)
- Added
find_delays - Created
_create_figurecontaining all the plotting-related code - Modified the graph plot when the max correlation is below threshold
- Minor corrections in docstrings
1.0 (2024-04-12)
- Initial release
If you detect any bug, please open an issue.
Thanks! 🦆