This is the project repository for Group 12 in STAT547M in the University of British Columbia. The project is an assessment of PM2.5 pollution from 2010 to 2014 in Beijing, China.
Margot Chen, Qi Yang
Here are the links to:
-
Project Interest
Beijing, the capital city of China, has been fighting againstPM2.5pollution in recent years.PM2.5are fine airborne particles less than 2.5μm that can cause severe damage to human health. Meteorological conditions(wind, humidity, etc) can contribute to the formation ofPM2.5according to previous studies. We are interested in whether there are correlations between Beijing’sPM2.5concentration and meteorological conditions. If so, analyzing meteorological conditions can help us assess and even predict the air quality in Beijing. -
Data Description
The dataset we used is from University of California Irvine Machine learning Repository. It was originally uploaded by Songxi Chen in Peking University, China. This is an hourly dataset containingPM2.5concentration and meteorological statistics from Jan 1st, 2010 to Dec 31st, 2014. -
Plans
We attempt to address whether Beijing'sPM2.5is correlated with meteorological conditions(dew point, temperature, pressure, wind speed and direction, rain or snow) and time(year, month, day). Our steps include: data cleaning, correlation tests, linear regression analyses, plotting, dashboard creation. A more detailed proposal in HTML version can be found here.
The links below lead to the releases/milestones and final reports. They will be updated through the course.
Milestone 1: release1.0 html
Milestone 2: release2.0
Milestone 3: release3.0 final report
Milestone 4: release4.0
Milestone 5: release5.1
Milestone 6: release6.0
In our dashboard of Beijing PM2.5 dataset, we want to enable users to explore the two research questions:
- How did Beijing PM2.5 change over time?
- How did weather factors, namely temperature, pressure, dew point, combined wind direction, and cumulated wind speed, relate to PM2.5.
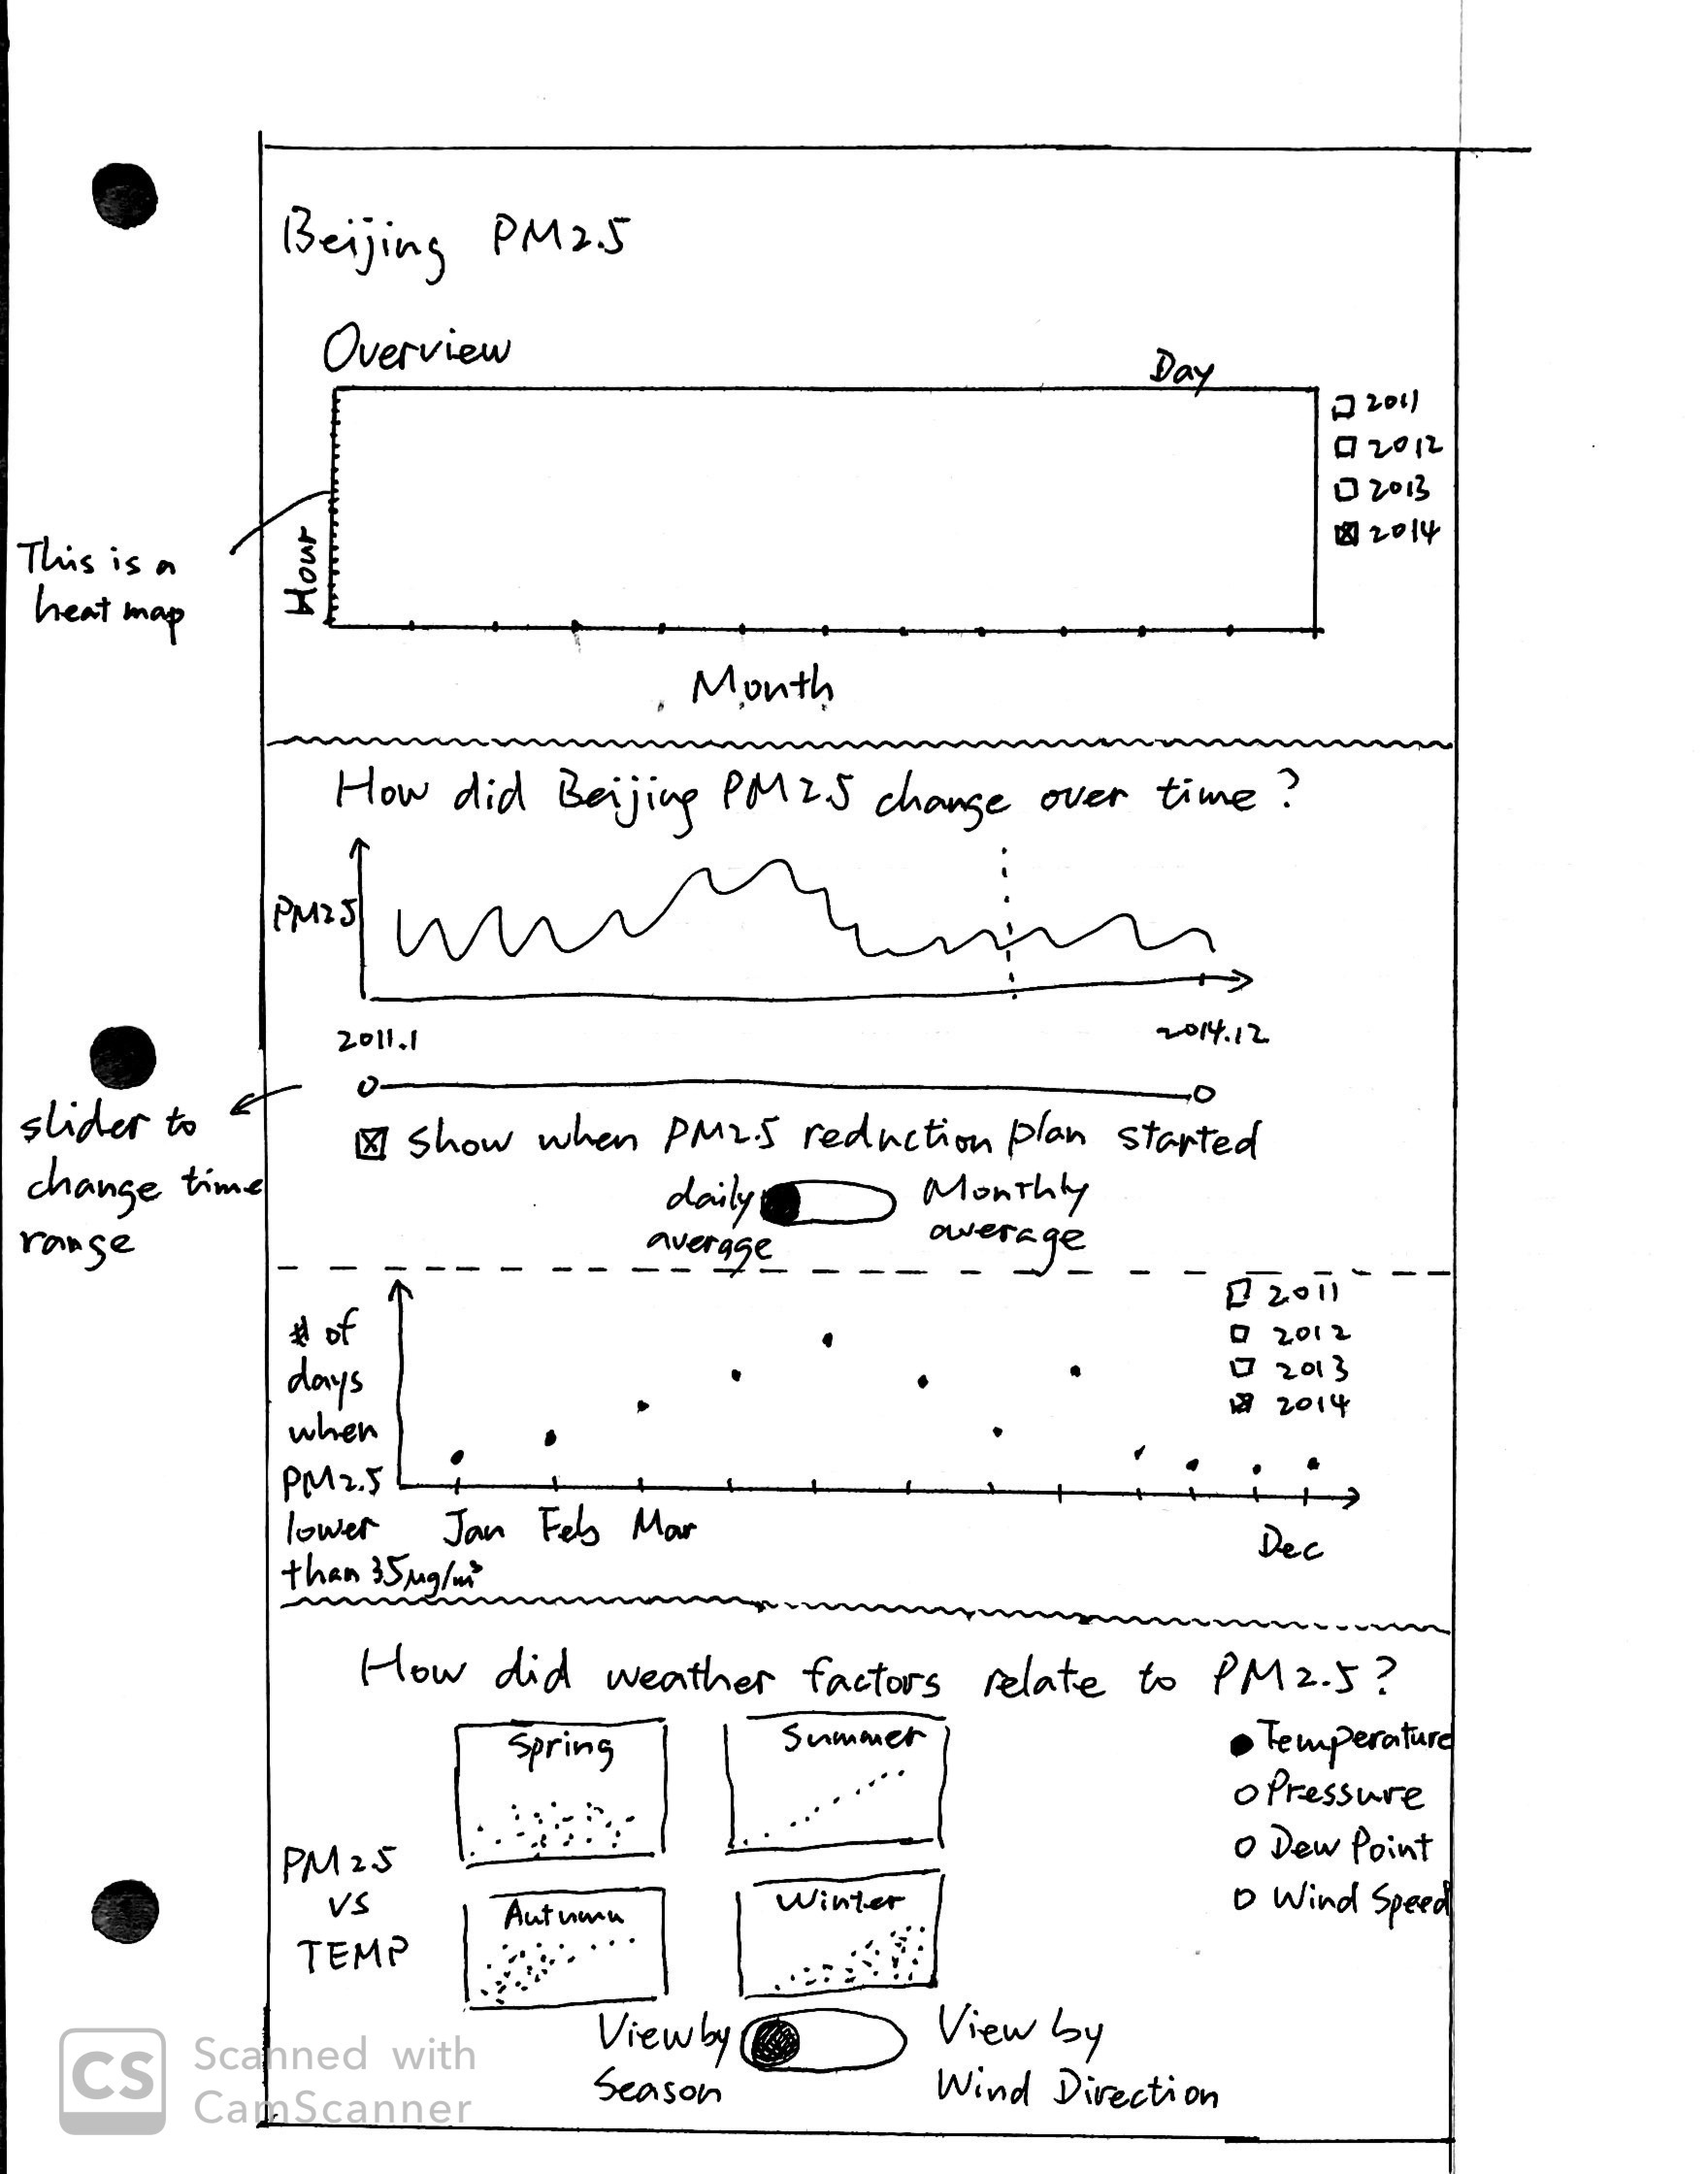
This dashboard will have a heatmap overview of hourly PM2.5 from 2012-2014. Users will be able to select the time range of interest.
To address Research Question 1, we will use two graphs. One is a line chart of daily or monthly average PM2.5 across the four years. Users will be able to choose the granularity of data, i.e. daily or monthly. Since the daily PM2.5 has been changing rapidly and hard to follow, we will also use number of days when PM2.5 is lower than 35 as another indicator. In the second graph, we will show the monthly number of days under 35 across the four years.
To address Research Question 2, we will use a faceted scatter plot. Users will be able to choose "view by seasons" or "view by wind direction". Within each view, users can pick weather factors and see the relationship between PM2.5 and the chosen weather factor.
Xiaowang is a college student living in Beijing. He cares about the wellbeing of people in Beijing and is curious about which factor(s) affect PM2.5. He also wants to know whether regulations with regard to air quality have been effectively improving the situation. He has basic literacy of reading charts and figures.
Once Xiaowang open the dashboard, he will see a heatmap of hourly PM2.5 of 2014. He can also pick other years from a checkbox. In the heatmap he can notice a seasonal pattern: PM2.5 tends to be lower during spring and summer.
To find out how PM2.5 changed overtime, Xiaowang moves on to the second section of the dashboard, where he can find the daily and monthly average PM2.5 from 2011-2014. He can also choose to show the date when PM2.5 Reduction Plan was implemented, and check out if things have changed since then. The second graph in this section shows the number of days when PM2.5<35 in each month. Xiaowang can decide which years to display on this graph. He will notice that things haven't changed much after Sep 1st, 2013, when the PM2.5 Reduction Plan was carried out.
To explore how weather factors related to PM2.5, Xiaowang moves to the third section, where he can pick single factors and see its relation with PM2.5. Noticing that these relations can be different under different seasons or wind directions, Xiaowang can pick "view by seasons" or "view by wind direction". But it's a bit disappointing that no single weather factor shows strong correlation with PM2.5. Xiaowang may develop an understanding that weather conditions cannot predict PM2.5 very well.
docs: .Rmd, .html and.md files, including a proposal and a final report.
data: Raw and cleaned/wrangled datasets.
scripts: .R scripts for different usage.
images: Images exported from scripts.
tests: Tests for functions.
-
Clone this repo.
-
Ensure the following packages are installed:
dplyr,tidyr,tidyverse,docopt,here,glue,ggplot2,corrplot,foreign,lubridate,viridis
- Run the following scripts (in order) with specified arguments.
-
load_data.R: Save the raw data as a .csv in the
datafolder from an external URL.
Rscript scripts/load_data.R --data_url="https://archive.ics.uci.edu/ml/machine-learning-databases/00381/PRSA_data_2010.1.1-2014.12.31.csv" -
data_wrangle.R: Save a new cleaned dataset as a .csv in the
datafolder.
Rscript scripts/data_wrangle.R --raw_path="data/raw_data.csv" --clean_path="data/cleaned_data.csv" -
eda.R: Run exploratory data analysis and save the plots in a user defined location.
Rscript scripts/eda.R --raw_path="data/raw_data.csv" --clean_path="data/cleaned_data.csv" --image_folder_path="images" -
model.R: Run a linear regression and save the model in a user defined location.
Rscript scripts/model.R --clean_path="data/cleaned_data.csv" --model_path="data/model.rds" -
knit.R: Knit the final report.
Rscript scripts/knit.R --rmd_path="docs/finalreport.Rmd"
- Open the Terminal in your RStudio. Type the following options according to your needs:
-
Check if
makehas already been installed:
make- If yes:
make: *** No targets specified and no makefile found. Stop. - If no:
Command not found
- If yes:
-
If you want to get all targets:
make all -
If you want to clear all existing targets and recreate them:
make clear