Galaxia is envisioned as a dynamic monitoring framework with the following goals
- One single repository for all the monitoring metrics
- On demand dynamic generation of monitoring dashboard
- Capability to export metrics to your favorite systems(orchestrator, analytic engines, alarm systems etc)
- Capability to generate reports
- Capability to generate alerts and notifications
- Capability to bring in intelligence among metrics from various systems
- Complete end to end microservice monitoring from application all the way to infrastructure
- Why Galaxia
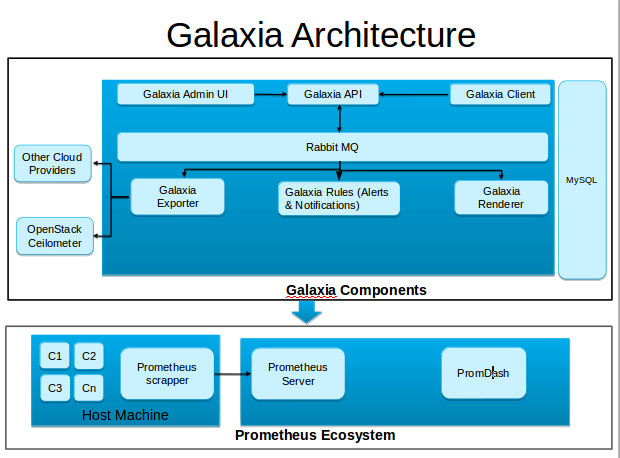
- Architecture
- Galaxia Current Capabilities
- Future Roadmap
- How Galaxia works?
- Setup Galaxia
- Testing Galaxia Services
- Contributing to Galaxia
With the advent of cloud & container technologies monitoring needs for an enterprise has reached multiple folds. Today there is no single open source solution which provides collecting & co-relating monitoring statistics from various systems. Some of the pain points today organization face:
-
In a traditional software deployment model an application and most of its components will run on a high capacity single server and hence all it was required to monitor this single server. Today in a cloud & container deployment an application is now broken down into micro services where each service may be spread across multiple containers, containers being spread across multiple VM’s and VM’s being spread across multiple hosts. In such a deployment which is the need of the day it becomes extremely difficult to co-relate the metrics from hundreds & thousands of deployment units.
-
Ability to easily visualize real time metrics at different levels and easily narrow down to specific resource that you are interested
-
Monitoring needs of an organization often includes - Application monitoring which includes monitoring for performance, stability, accuracy, log, database & transactions. - Infrastructure monitoring which includes monitoring compute (RAM, CPU, I/O, Load, Temperature etc), Network (port, switch, adapters, interfaces, bridges etc) & Storage. - Non-App monitoring which includes monitoring application cluster, hardware clusters, software load balancer, hardware load balancer & network firewalls - Some more may include devops monitoring, code instrumentation, device monitoring and many more With so many of above heterogeneous monitoring needs, an enterprise needs to maintain multiple metrics repository, multiple end user dashboards & there exists no co-relation b/w metrics from so many different sources.
- Monitor your docker containers running on bare-metal, virtual machines or your cloud environment
- Also monitor the underlying infrastructure such as bare-metal, virtual machines or your cloud environment.
- On demand monitoring dashboard generation either through command line or an intutitive Graphical User Interface
- On demand monitoring dashboard generation using a regex search
- Export docker container metrics as a scheduled job to your favorite system for alerts, notifications & alarms, currently this functionality is available for OpenStack Ceilometer
- Ability to list down all the containers, hosts being monitored and their relationship.
- Capability to subscribe for alerts and notifications
- Remove dependency on promdash for dashboard rendering
- Capability to group related dashboards
- Capability to pause, stop and resume outbound exporter jobs
- Capability to generate custom reports
- Capability to bring in intelligence among metrics from various systems and generate an integrated dashboard
- Integrate with another third party metrics renderer like grafana
- Provide capacity planning capabilities via advanced analytics
- Capability to segregate dashboards as per user profile
- Co-relation between metrics and associated drilled down capabilities
Currently galaxia has integration with following 2 UI projects:
- One which is galaxia-ui. This project consumes the api's exposed by galaxia and is being developed as another project side-by-side of galaxia. Below are the screenshots from galaxia-ui
Summary of the complete target infrastructure
This screenshot details the complete summary of your target infrastructure and applications.

List of hosts currently being monitored
This screenshot Lists the summary of host bein monitored currently

Favorite metrics for host
This screenshot lists the favorite metrics of host being monitored currently

Favorite metrics for host
This screenshot lists the drill down between host and containers

- Secondly with Promdash UI
Promdash has deprecated as per the prometheus community and hence we recommend using galaxia-ui project. Promdash find integration with
galaxia via the galaxia renderer service
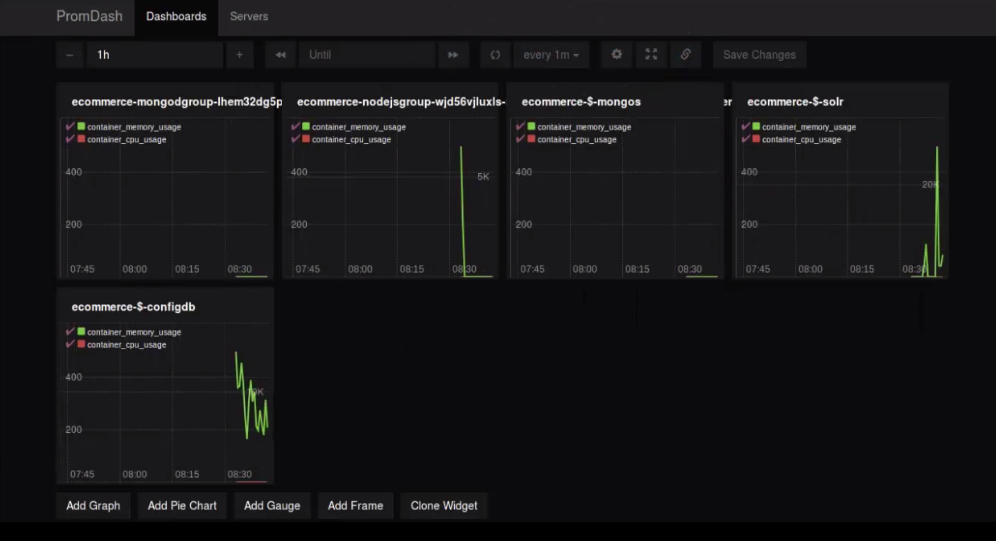
Below are some of the screenshots from promdash
Home Page of Promdash with Ecommerece Dashboard

**Container monitoring with Promdash**

Galaxia works on the concept of exporter, aggregator and renderer. Here exporter is a docker container which exports metrics to the aggregator. Exporter unit runs on each node from which we wish to capture the metrics. Aggregator collates metrics from all the exporter in its local database. Renderer connects to aggregator and generates the monitoring dashboard. Currently renderer is only supported for promdash.
We recommend using Vagrant to set up galaxia. Here are the steps to setup Vagrant on ubuntu:
- Run the following commands to setup vagrant
- sudo apt-get install virtualbox
- sudo apt-get install vagrant
- Launch virtual box UI, on ubuntu this can be done in 2 ways either by running virtualbox from shell prompt or using ubuntu search box.
- Go to File->Preferences->Network->Host-Only Networks. Create a new network. Edit this network and provide the IPV4 address as 192.168.76.1. Save and exit the VirtualBox UI
- curl https://raw.githubusercontent.com/WiproOpenSourcePractice/galaxia/master/Vagrantfile > Vagrantfile
- vagrant up
- Login to vagrant box using the command
vagrant ssh galaxia
This brings up a virtual environment and now proceed with installing galaxia
Galaxia can be installed in following 2 ways
- Using Ansible
- Manual Setup
We recommend using vagrant to run this installation steps.
The install directory in galaxia source has the ansible script to install galaxia and all the dependent components. To run this script the host needs to have Ansible installed.
Now set the following entry in /etc/ansible/hosts
[galaxiainstall]
localhost
If you are on AWS than you need to add the following entry instead
[galaxiainstall]
<hostname> ansible_ssh_private_key_file=<location_of_your_private_key>
Clone the galaxia source code
git clone https://github.com/WiproOpenSourcePractice/galaxia
Now galaxia by default supports sqlite as the backend. Go to install directory & run the command
ansible-playbook site.yml
If instead of sqlite you want to use mysql as the backend than follow the below steps:
- Uncomment the mysql role in site.yml
- In galaxia/templates modify the galaxia.conf.j2 and under [db] change the type from 'sqlite' to 'mysql'
- In galaxia/tasks/install.yml. Under the task name "Install galaxia" modify "--type sqlite" to "--type mysql"
Once done you can run the playbook as suggested above.
This will setup an ALL-IN-ONE Galaxia with-in few minutes depending on your network speed. Once done skip to section Testing Galaxia Services
Follow the steps below to setup Galaxia, the steps are specific to ubuntu operating system and hence will have to be modified accordingly for other OS.
We are using vagrant box with ubuntu 14.04 to add up all the components To successfully operate Galaxia following softwares are required to be installed
- python v2.7
- python pip
- mysql-server
- rabbitmq-server
- Prometheus
- Promdash
- Docker
- cadvisor
- Galaxia
Ubuntu comes with Python v2.7 out of the box
Install Python Pip on ubuntu using the following command sudo apt-get -y install python-pip
Follow the steps below to install mysql-server on ubuntu
- sudo apt-get update
- sudo apt-get install -y mysql-server
When prompted Set up username as "root" and password as "root". By default mysql server listens on port 3306.
sudo apt-get install -y rabbitmq-server
By default rabbitmq server listens on 5672.
- Download Prometheus version prometheus-0.16.1.linux-amd64.tar.gz from https://github.com/prometheus/prometheus/releases. Here is the direct link
- Decompress the file prometheus-0.16.1.linux-amd64.tar.gz using the command "tar xzf prometheus-0.16.1.linux-amd64.tar.gz"
- In the root directory create the file prometheus.yml with the following content
    # my global config
        global:
            scrape_interval:     15s # By default, scrape targets every 15 seconds.
            evaluation_interval: 15s # By default, scrape targets every 15 seconds.
    # scrape_timeout is set to the global default (10s).

    # Attach these labels to any time series or alerts when communicating with
    # external systems (federation, remote storage, Alertmanager).
    #        external_labels:
    #            monitor: 'codelab-monitor'

    # Load and evaluate rules in this file every 'evaluation_interval' seconds.
            rule_files:
                # - "first.rules"
                # - "second.rules"

    # A scrape configuration containing exactly one endpoint to scrape:
    # Here it's Prometheus itself.
            scrape_configs:
    # The job name is added as a label `job=<job_name>` to any timeseries scraped from this config.
                - job_name: 'prometheus'

    # Override the global default and scrape targets from this job every 5 seconds.
                  scrape_interval: 5s
                  scrape_timeout: 10s

    # metrics_path defaults to '/metrics'
    # scheme defaults to 'http'.

                  target_groups:
                    - targets: ['localhost:8090']
- Now you can start prometheus server using the following command
./prometheus -config.file=prometheus.yml
Prometheus by default listens on port 9090
Steps to install Promdash
- Install git using the command
sudo apt-get install -y git
git clone https://github.com/prometheus/promdash
- In the root promdash directory run the command
cp config/database.yml.example config/database.yml
- Configure database.yml "production tag" with host, username and password.
- Set the database tag to "galaxia".
- Set the following environment variables, substitute the values for username, password & host
    export DATABASE_URL="mysql2://username:password@host/galaxia"
    export RAILS_ENV="production"
- Now install bundler using the command
sudo apt-get install -y bundler"
sudo apt-get install -y libpq-dev mysql-client libmysqlclient-dev libsqlite3-dev
bundle install
bundle exec rake db:setup
This will set up db tables required for promdash
make build
bin/env bin/bundle exec bin/thin -p 3000  start
Promdash is listening on port 3000
- Launch the promdash page using the url http://localhost:3000 and add a new server, set the Uri as http://<ip_address>:9090 & Server type as prometheus.
Install docker using the link https://docs.docker.com/engine/installation/linux/ubuntulinux/
cadvisor is being used as a metrics exporter here, we use a docker image here
- Download the cadvisor image from https://hub.docker.com/r/google/cadvisor/
- Start cadvisor using the following command
     sudo docker run --volume=/:/rootfs:ro --volume=/var/run:/var/run:rw --volume=/sys:/sys:ro --volume=/var/lib/docker/:/var/lib/docker:ro  --publish=8090:8080   --detach=true
     --name=cadvisor google/cadvisor
Steps to install Galaxia
- Download the source from <github_url>
- Install MySQL Driver for python
    sudo apt-get -y build-dep python-mysqldb
    sudo pip install MySQL-python
    sudo pip install -r requirements.txt
    sudo python setup.py install
- Run the tools/database.py as follows, here host is mysql host and username/password are for mysql
python database.py --host localhost --type mysql --username root --password root**
This completes galaxia installation.
Galaxia comes up with following services gapi, grenderer and gexporter. Let us start them one by one To test gexporter service you will need to setup OpenStack
Run the following commands to start gapi service. The gapi service can be started in on of the two ways.
-
Development Mode
source openrc_example gapi --config-file etc/galaxia/galaxia.conf -
Production Mode - This would require to install uwsgi which on ubuntu can be installed using "sudo pip install uwsgi". Change to galaxia source directory and Start gapi as follows:
  source openrc_example
  uwsgi --http-socket :8050 --pecan galaxia/gapi/config.py --master --processes 4 --threads 4 &
No of threads and processes can be configured as per your underlying hardware.
Run the following commands to start grenderer service
```
 source openrc_example
 grenderer --config-file etc/galaxia/galaxia.conf
```
Run the following commands to start gexporter service
```
source openrc_example
gexporter --config-file etc/galaxia/galaxia.conf

```
Currently galaxia supports containers and hence we need to start some containers on the host to test galaxia services. We will use httpd server(https://hub.docker.com/_/httpd/) images from docker hub for that
- start couple of httpd container
sudo docker run --name sample_http -d  httpd
sudo docker run --name sample_http1 -d  httpd
- run some galaxia commands now
source openrc_example
1) galaxia --help
2) galaxia metrics list - This will give the list of supported metrics for each type. Some examples
below:
galaxia metrics list --type docker
galaxia metrics list --type node
galaxia metrics list --type postgres
galaxia metrics list --type mysql
galaxia metrics list --type tomcat
3) galaxia dashboard create - This will create a dashboard on promdash.Some examples below:
galaxia dashboard create --name terase092 --metrics-list container_memory_usage_bytes container_cpu_system_seconds_total
--search-string 192.168.76 --search-type instance --unit-type docker
galaxia dashboard create --name terase092 --metrics-list container_memory_usage_bytes container_cpu_system_seconds_total
--search-string 192.168.76 --search-type instance --unit-type docker –-exclude 1
4) galaxia catalogue list - This will list all the entities being monitored for a type
galaxia catalogue list --unit-type container
galaxia catalogue list --unit-type node
5) galaxia status list - availability monitoring
galaxia status list --unit-type container
galaxia status list --unit-type container --time-interval 1w
6) galaxia label list - List out the labels for a metrics
galaxia label list --unit-type container --meter-name container_fs_read_seconds_total
galaxia label list --unit-type app  --meter-name pg_runtime_variable_max_connections
7) galaxia register agent - Onboards an application, node, container
galaxia register agent --unit-type app --host 192.168.76.20 --port 9104 --instance-key mysql001 --job-name OpenSourcePractice
- Using curl command
- Create Dashboard
 http://localhost:7000/v1/gapi "PUT Request" with the following data
{"name": "ashish08" , "unit_type": "docker", "metrics_list": ["container_memory_usage_bytes", "container_cpu_system_seconds_total"], "names_list": ["httpd1_ecom1", "test123"]}
- Update Dashboard
http://localhost:7000/v1/gapi "POST Request" with the following data
{"name": "ashish08" , "unit_type": "docker", "metrics_list": ["container_memory_usage_bytes", "container_cpu_system_seconds_total"], "names_list": ["httpd1_ecom1"]}
- Delete Dashboard
http://localhost:7000/v1/gapi "DELETE Request" with the following data
{"name": "ashish08"}
- Create Dashboard using search strings and type
http://localhost:7000/v1/gapi "PUT Request" with the following data
{"name": "ashish09" , "unit_type": "docker", "metrics_list": ["container_memory_usage_bytes", "container_cpu_system_seconds_total"], "search_string": "httpd", "search_type": "image"}
- Catalogue API usage
http://localhost:7000/v1/catalogue?unit_type=container
http://localhost:7000/v1/catalogue?unit_type=dashboard
- Metrics API usage
http://localhost:7000/v1/metrics?type=container
- Exporter API usage
http://localhost:7000/v1/exporter
{"source_system": "prometheus", "target_system": "ceilometer", "metrics_list": ["cpu"], "time_interval": "1", "unit_type": "docker",  "exporter_name": "ashish2"}
- Alert and Notification API Galaxia now supports alert and notifications. There are two capabilities supported
- Retrieve all the active alerts
- Post alerts from custom systems to alertmanager.
To retrieve all the active alerts run a GET call as
http://localhost:7000/v1/alert
To post a custom alert. Send a POST request with the following payload
http://localhost:7000/v1/alert
{"labels": {"service": "Galaxia","name": "galaxia-node"},
 "description": "Service galaxia for node has been successfully spawned",
 "generator": "openapp"
}
- Galaxia uses github to manage our code, bugs, features. Pick up any bug and share your code fix with us using github pull requests. For more details look into - Working with Pull Requests
- For any discussions or questions please reach us our google groups @ https://groups.google.com/forum/#!forum/wipro-opensourcepractice-galaxia
- Join our meetup group @http://www.meetup.com/Bangalore-Prometheus-Meetup-Group/
1.Fork the repository.
Go to 'Galaxia' project on github website and click on the 'Fork' button to create your fork.

2.Clone the repository locally.

Copy your fork repository URL and run the following command from git bash.
git clone <your-repository-url>
3.Create a branch - creating an environment where you can try out your ideas. This will not affect master branch.
git branch <branch-name>
git checkout <branch-name>
4.Make your changes and test it out. Once you are ready to commit, follow the next step.
5.Commit your changes to your fork.
git add <file-name>
git commit -m "your commit message"
git push origin <branch-name>
6.Open pull requests from your fork to main repository from github website.
