
https://github.com/esp8266/Arduino
https://github.com/espressif/arduino-esp32
About Standard telnet News Wishlist Using Know issues Releases Thanks
By default the Arduino only has as debug possibility via the Serial port. This has a few disadvantages:
- requires a physical cable to the Arduino device (if the device is far away or in a remote location this is not easy)
- debugging multiple Arduinos at the same time requires many serial ports and a lot of cables
With the ESP8266 (NodeMCU) or ESP32 we now have network connectivity which can be used for streaming debugging information in real-time.
This library is good for IoT projects, mobile robots (can debug it in moviment with a cable ?), WiFi or BLE projects, etc.
The MiP_ESP8266_Library is a example of this. see in: https://github.com/Tiogaplanet/MiP_ESP8266_Library
RemoteDebug is improved with client buffering (is last send is <= 10ms), to avoid misterious delays of networking on ESP32 and ESP8266 boards
Note: If your project is not wireless, you can use my another library, the SerialDebug library. SerialDebug Github This works in any Arduino, except for Tiny* AVR boards.
Telnet is a standard way of remotely connecting to a server and is supported on all operating systems (Windows, Mac, Linux...).
MacOSx and Linux have a native telnet client.
For Windows, a typical telnet client is the Putty: putty .
Have a good tool for mobiles: the Fing, please find it in your mobile store. Its show all devices in local network, show ports opened and can execute the telnet client too (external App)
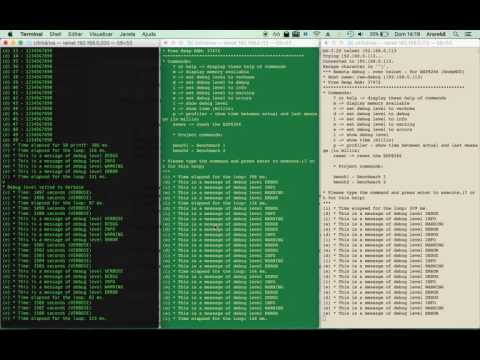
RemoteDebug sets-up a telnet server which is listening to any telnet client that wants to connect. After connection, logging is streamed to the telenet client.
RemoteDebug is very simple to use, after a few lines of initialization code, you can use the well-known "print" commands to stream your logging to the remote client.
RemoteDebug supports the filtering of logging based on debug levels:
Only show for it actual debug level:
- Verbose
- Debug
- Info
- Warnings
Note: These levels are in the order of most-logging -> least-logging.
Or for always show (not depends of actual debug level):
- Any
- Errors
Note: All debugs is processed and showed only if have a client connection.
The telnet client can set the debug level by typing a few simple commands.
RemoteDebug includes a simple profiler. It can be enabled by the connected telnet client or the Arduino code itself.
When enabled, it shows the time between 2 debug statements, using different colors depending on the elapsed time.
A typical example would be to insert logging just before and after a function after which you can see how much the is spent in the function.
RemoteDebug is designed to give minimal overhead (connected or not) and only process debugs,if there is a telnet client connected.
RemoteDebug supports custom commands that can be entered in the telnet client. These trigger the execution of a custom function in the Arduino code. For example this can be used to send back a status on request of the telnet client.
The current version of RemoteDebug does not yet include any authentication and is intended only for development.
Future extension could include a secure way for authentication and further testing to support production environments.
In 1.5.0 version, we have rdebug* macros (see below), debugs with auto funcion name and core id (core id only for ESP32). And new rdebug?ln macros to put auto new line.
So:
void foo() {

    uint8_t var = 1;

    rdebugVln("this is a debug - var %u", var); // see a suffix ln in rdebug macro
}

void loop() {

    // ....

    foo();

    // ....
}
It will show in telnet client:
(V p:^0000ms) (foo)(C1) this is a debug - var 1
Where:
  V -> verbose
  p -> profiler time
  (foo) -> this is a function name that calls the rDebug*
  (C1) -> It is running it Core 1 (only for ESP32)
And You can change port number in begin method (see below)
- Http page to begin/stop the telnet server
- Authentication as telnet support (kerberos, etc.) to support production environment

Youtube:
#include "RemoteDebug.h" // Remote debug over telnet - not recommended for production, only for development RemoteDebug Debug;
In the setup function after WiFi initialization
// Initialize the telnet server of RemoteDebug

Debug.begin("Telnet_HostName"); // Initiaze the telnet server - this name is used in MDNS.begin

// OR

Debug.begin(HOST_NAME); // Initiaze the telnet server - HOST_NAME is the used in MDNS.begin

// OR

Debug.begin(HOST_NAME, PORT); // Initiaze the telnet server - HOST_NAME is the used in MDNS.begin

// OR

Debug.begin(HOST_NAME, startingDebugLevel); // Initiaze the telnet server - HOST_NAME is the used in

// OR

Debug.begin(HOST_NAME, PORT, startingDebugLevel); // Initiaze the telnet server - HOST_NAME is the used in

// Options

Debug.setResetCmdEnabled(true); // Enable the reset command

// Debug.showProfiler(true); // To show profiler - time between messages of Debug
In the tail of loop function
// Remote debug over telnet

Debug.handle();
In any place of you code:
if (Debug.isActive(Debug.<level>)) {
    Debug.printf("bla bla bla: %d %s", number, str); // OR
    Debug.printf("bla bla bla: %d %s", number, str.c_str()); // Note: if type is String need c_str() // OR
    Debug.println("bla bla bla 2 ln");
    Debug.printf("float: %f\n", value); // Not works in ESP8266 :-(
    // Note: to show floats with printf (ESP8266 only),
    // you can use my ArduinoUtil library -> https://github.com/JoaoLopesF/ArduinoUtil
    Debug.printf("float: %s\n", Util.formatFloat(value, 0, 5).c_str());
}
Or short way (new) (prefered if only one debug at time):
rdebugA("This is a any (always showed) - var %d\n", var);
rdebugV("This is a verbose - var %d\n", var);
rdebugD("This is a debug - var %d\n", var);
rdebugI("This is a information - var %d\n", var);
rdebugW("This is a warning - var %d\n", var);
rdebugE("This is a error - var %d\n", var);

rdebugV("This is a println\n"); // Note: if you want a simple println you must ended with new line characters

// Or with new ln macros:

rdebugAln("This is a any (always showed) - var %d", var);
rdebugVln("This is a verbose - var %d", var);
rdebugDln("This is a debug - var %d", var);
rdebugIln("This is a information - var %d", var);
rdebugWln("This is a warning - var %d", var);
rdebugEln("This is a error - var %d", var);

rdebugVln("This is a println");
Instead of rdebug can be used old short way:
DEBUG_A(...)
DEBUG_V(...)
DEBUG_D(...)
DEBUG_I(...)
DEBUG_W(...)
DEBUG_E(...)
An example of use debug levels: (supposing the data is a lot of characteres)
if (Debug.isActive(Debug.VERBOSE)) { // Debug message long
    Debug.printf("routine: data received: %s\n", data.c_str()); // Note: if type is String need c_str()
} else if (Debug.isActive(Debug.DEBUG)) { // Debug message short
    Debug.printf("routine: data received: %s ...\n", data.substring(0, 20).c_str()); // %.20s not working :-|
}
An example of use debug with serial enabled
  Useful to see messages if setup or
  in cause the ESP8266/ESP32 is rebooting (telnet connection stop before received all messages)
  Only for this purposes I suggest it
// Setup after Debug.begin

Debug.setSerialEnabled(true); // All messages too send to serial too, and can be see in serial monitor
For reduce overheads RemoteDebug is disconnect the telnet client if it not active.
- Please pless enter or any key if you need keep the connection
- The default is 5 minutes (You can change it in RemoteDebug.h)
- You can use mDNS to register each node with different name, it helps to connect without know the IP.
Please not forget to use if clause with Debug.isActive (if not using rdebug*)
---> This is very important to reduce overheads and work of debug levels
Please see the samples, basic or advanced, to learn how to use
In advanced sample, I used WifiManager library, ArduinoOTA and mDNS, please see it.
- Fixed bug for MAX_TIME_INACTIVE, thanks to @achuchev to add this issue
- Adjustments based on pull request from @jeroenst (to allow serial output with telnet password and setPassword method)
- Serial output is now not allowed if telnet password is enabled
- Few adjustments
- Few adjustment in write logic
- Serial output adjustments (due bug in password logic)
- Correct rdebug macro (thanks @stritti)
- New silent mode (command s)
- Auto function name and ESP32 core id for rdebug* macros
- begin method have a option for port number
- Few adjustments
- Added new rdebug?ln to put auto new line
- Simple text password request feature (disabled by default)

    Notes:
      It is very simple feature, only text, no cryptography,
      and the password is echoed in screen (I not discovery yet how disable it)

      telnet use advanced authentication (kerberos, etc.)
      Such as now RemoteDebug is not for production (releases),
      this kind of authentication will not be done now.
- Adjustments in precompiler macros
- Bug in write with latest ESP8266 SDK
- Port number can be modified in project Arduino (.ino file)
-  Few adjustments as ESP32 includes
- Adjustments, as avoid ESP32 include errors
- Telnet port of server can be modified by project
  Just put it in your .ino, before the include:

```cpp
#define TELNET_PORT 1000

#include "RemoteDebug.h"
```
- Shortcuts and client buffering to avoid misterious delay of ESP networking
- Adjustments and now runs in Esp32 too.
- Adjustments and improvements from Beta versions.

  New features:

    - Filter
    - Colors
    - Support to Windows telnet client
- First Beta

    Warning !

    In beta versions, the **isActive** method was misspelled,
    Please when upgrading from a beta to the current one, please review your code.

    From:

    ```cpp
    if (Debug.ative(Debug.<level>)) ....
    ```

    To:

    ```cpp
    if (Debug.isActive(Debug.<level>)) ....
    ```
- Sometimes (rarely) the connection over telnet becomes very slow.
  Especially right after uploading firmware.
  Reset command in telnet connection or turn off/on can be resolve it.
  But I need find why it occurs
First thanks a lot for Igrr for bring to us the Arduino ESP8266.

Resources:

  - Example of TelnetServer code in http://www.rudiswiki.de/wiki9/WiFiTelnetServer