This is a project that was created for the Yhacks 2018 hackathon, and was created by Mohamed Beydoun, Valerian Clerc, Alexandre Falardeau, and Hanna Lee. The first major section of the application pulls images from different sources (currently crowdsourced user data and Google Places API) and manipulates them with computer vision techniques (OpenCV) to analyze them using the Google Vision API. This data is then bundled and made accessible to the frontend through a Node.js/Express.js API endpoint. The second major facet of the application takes the computed data from the backend and uses using Voronoi diagrams and Delauney triangulation to generate a network of colored polygons. These polygons are then displayed on a map as a visualization of the accessibility of the region (see example in demo).
The Google Vision is the star player of the application: we used it to complete the analysis on images we receive from users or from third party APIs. We process labels generated by the Vision AI, and use these labels to generate numerical accessibility ratings for those images.
We used the OpenCV computer vision python library to format our images to prepare them for upload to Google Vision API. Images were cut up so we could perform analysis on different sectors as to obtain more thorough data for the accessibility rating process.
The ExifReader library was used to extract the geo-location data (longitude and latitude) from .JPG images, so that we could associate our accessibility ratings with a location, and plot it on the map.
Express was used to manage our API endpoints for our image analysis backend.
We used MongoDB in tandem with the mongoose library to send and query data from a database. Our database was used to store image analysis results (accessibility results and coordinates).
ReactJs was used to structure the front-end section of the application. We use the react router to manage different front-end componnents while maintining a single page web application.
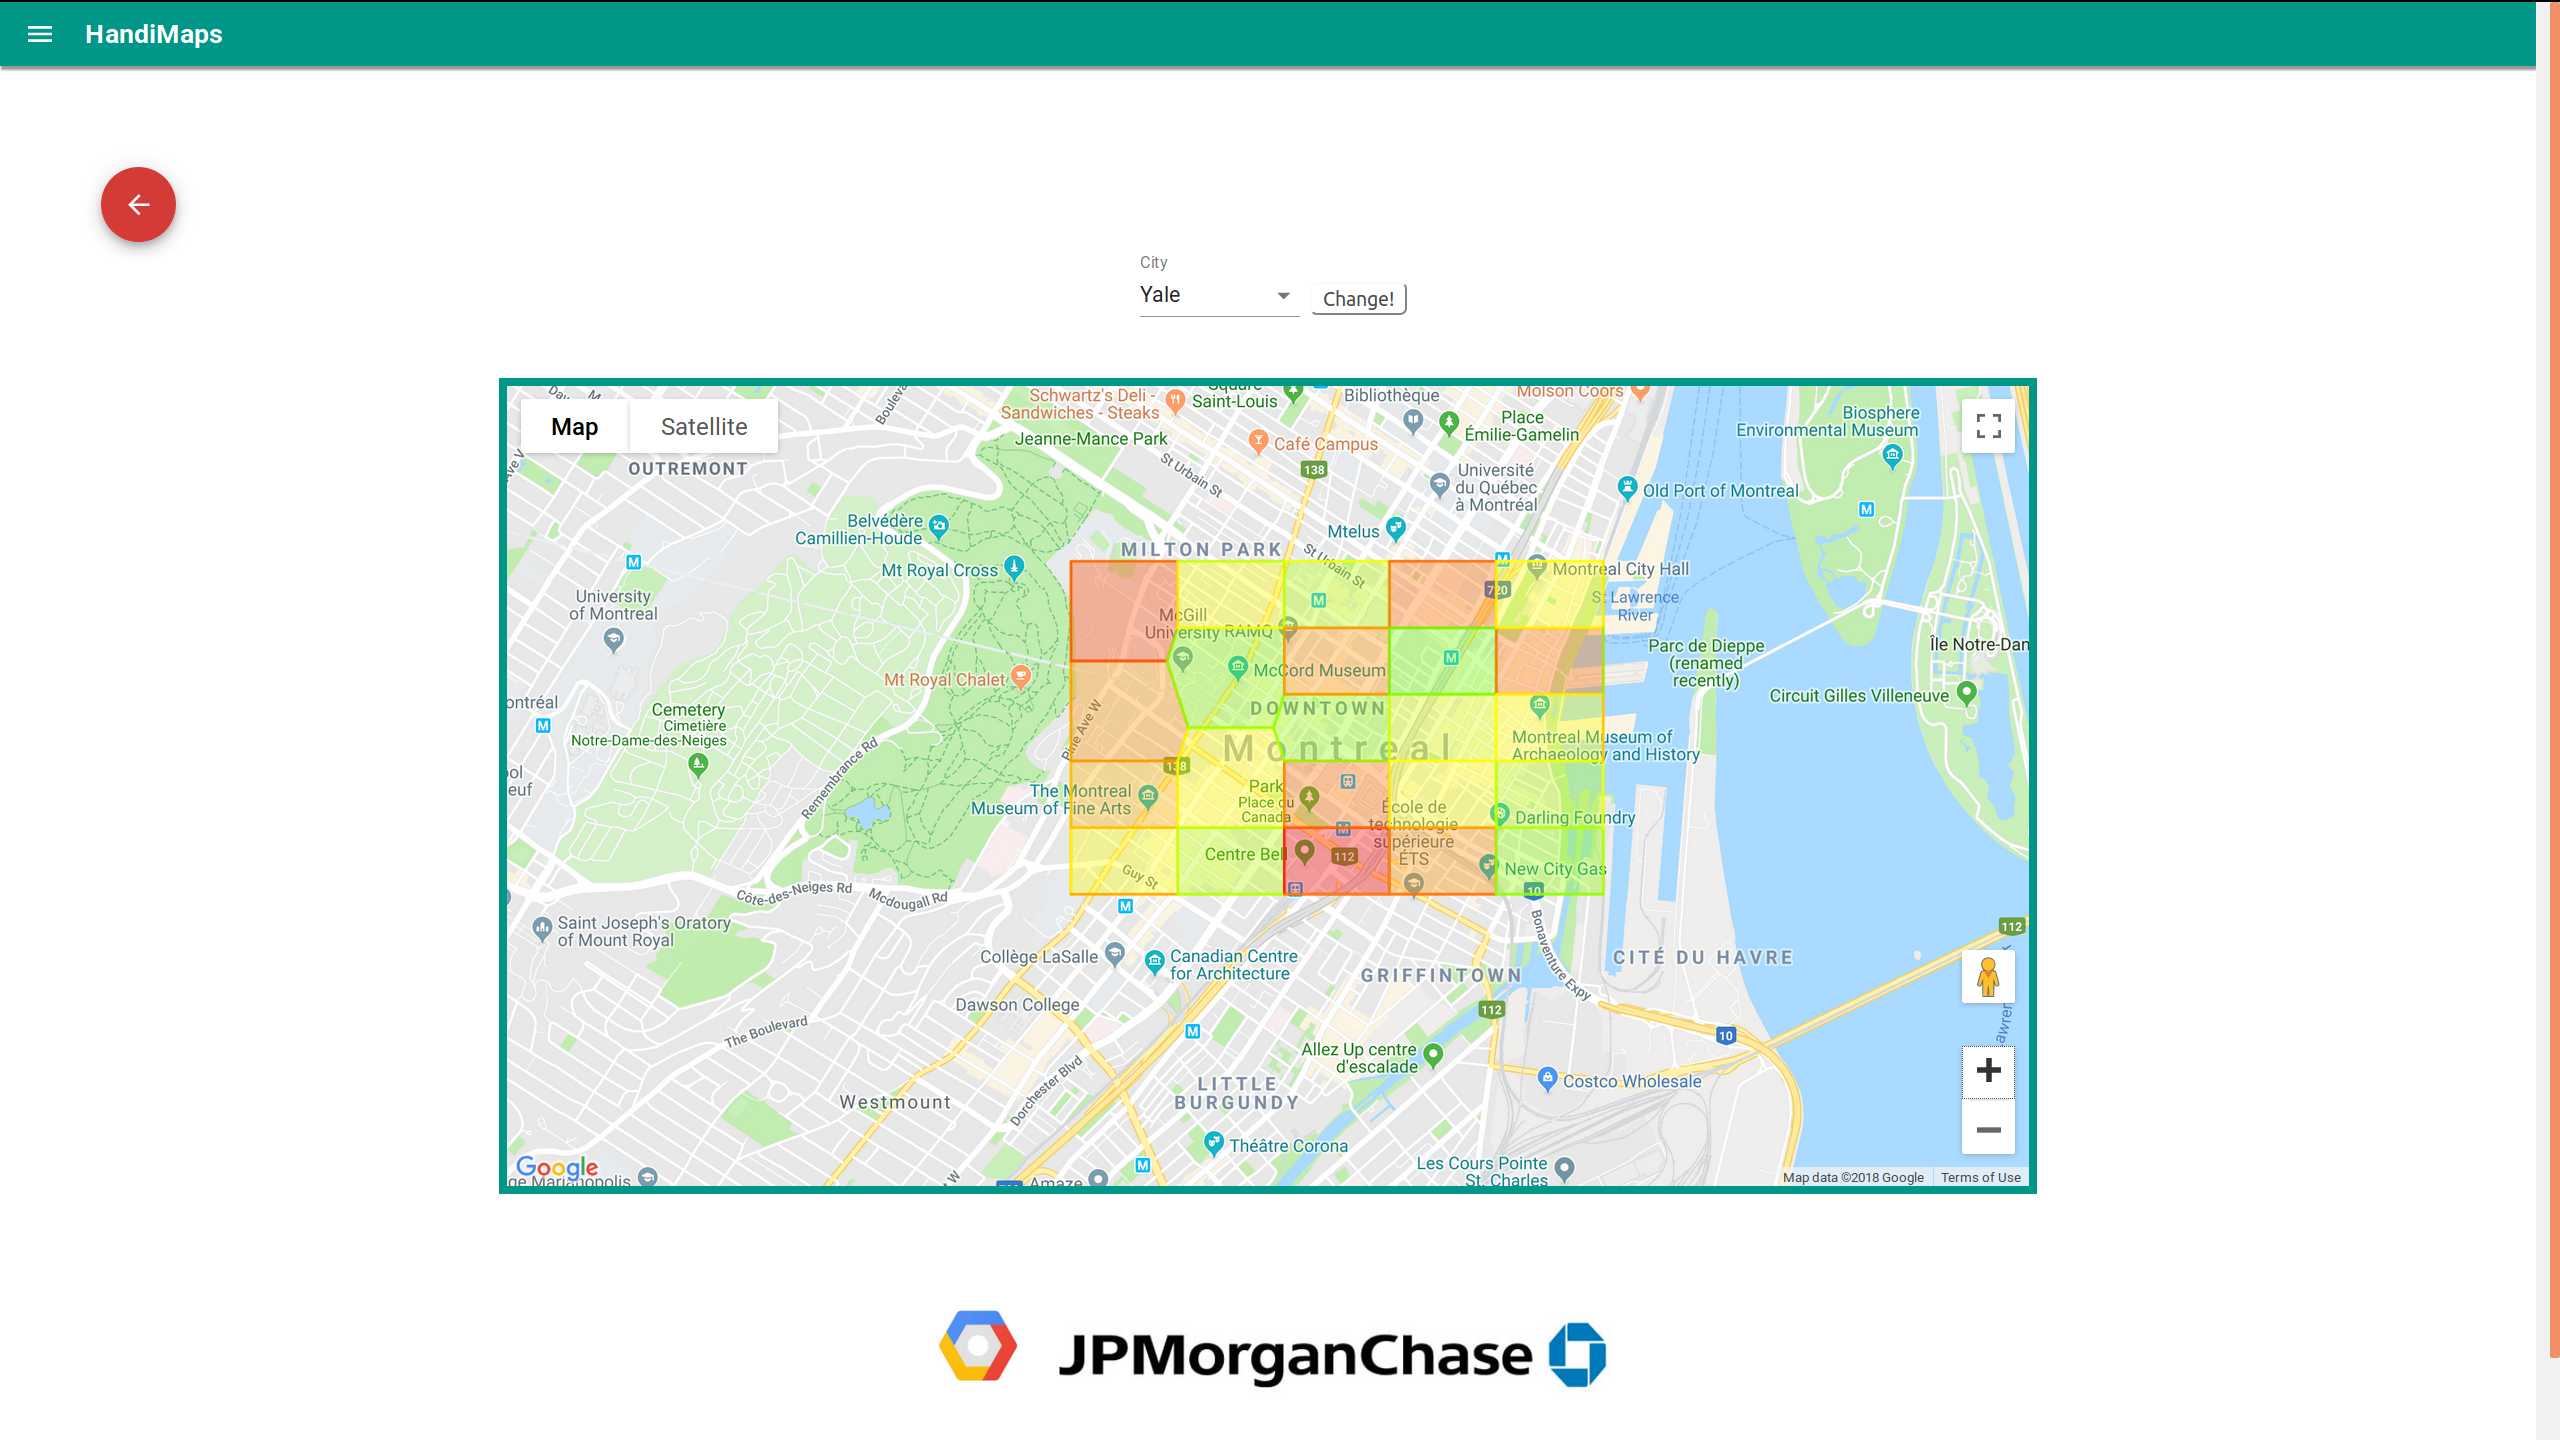
The google maps API is used to embed a map component into our react application. Using component overlays, we were able to display real-world data using by adding a network of colored polygons (see the demo for an example of this display).
D3 (or Data-Driven Documents) is a library for producing dynamic and interactive data visualizations in web browsers. For this project, it was used to transform the provided data from map coordinates to polygons in a Voronoi diagram centered around each of said coordinates. This type of diagram partitions the plane into regions based on the coordinates' distance from each other. The produced diagram will showcase which regions on the map are more (or less) accessible than the others, which will give the users a better idea of which routes to take and which to avoid. Note: This type of diagram increases in accuracy wih more data, as shown in the later sections of this guide.


- Requires file named 'yhackGCP.json' with GCP access (omitted from this repository because it contains sensitive account information). This can be generated by following these steps on Google's Vision API Documentation
- Run
mongodin its own terminal - Run
bash setup.bashin backend folder to setup - Run
npm startin the backend folder - Run
npm startin the frontend folder - Navigate to localhost:3000