A MATLAB project which analyzes a 13.8 kV, 50 MVA, 0.9–power–factor–lagging, 60 Hz, four-pole Y–connected three-phase stand-alone synchronous generator.
This project was assigned for the Energy Conversion (EE 304) course in the Spring 2022 semester.
matlab -nodisplay -nosplash -nodesktop -r "run('main.m');exit;"A 13.8 kV, 50 MVA, 0.9–power–factor–lagging, 60 Hz, four-pole Y–connected synchronous generator has a synchronous reactance of 2.5 Ω and an armature resistance of 0.2 Ω. At 60 Hz, its friction and windage losses are 1 MW, and its core losses are 1.5 MW. The field circuit has a DC voltage of 120 V, and the maximum field current,
, is 10 A. The current of the field circuit,
, is adjustable over the range from 0 to 10 A for which the OCC of this generator is given as:
In all of the plots, the phasors need to be in vector shapes, not as simple lines.
-
Create a MATLAB function for plotting the phasor diagram of the generator for different values of the stator current
, the field current
, the terminal voltage
, and the power angle. Explain briefly in your report theoretical calculations and include the code in the appendix of the report.
-
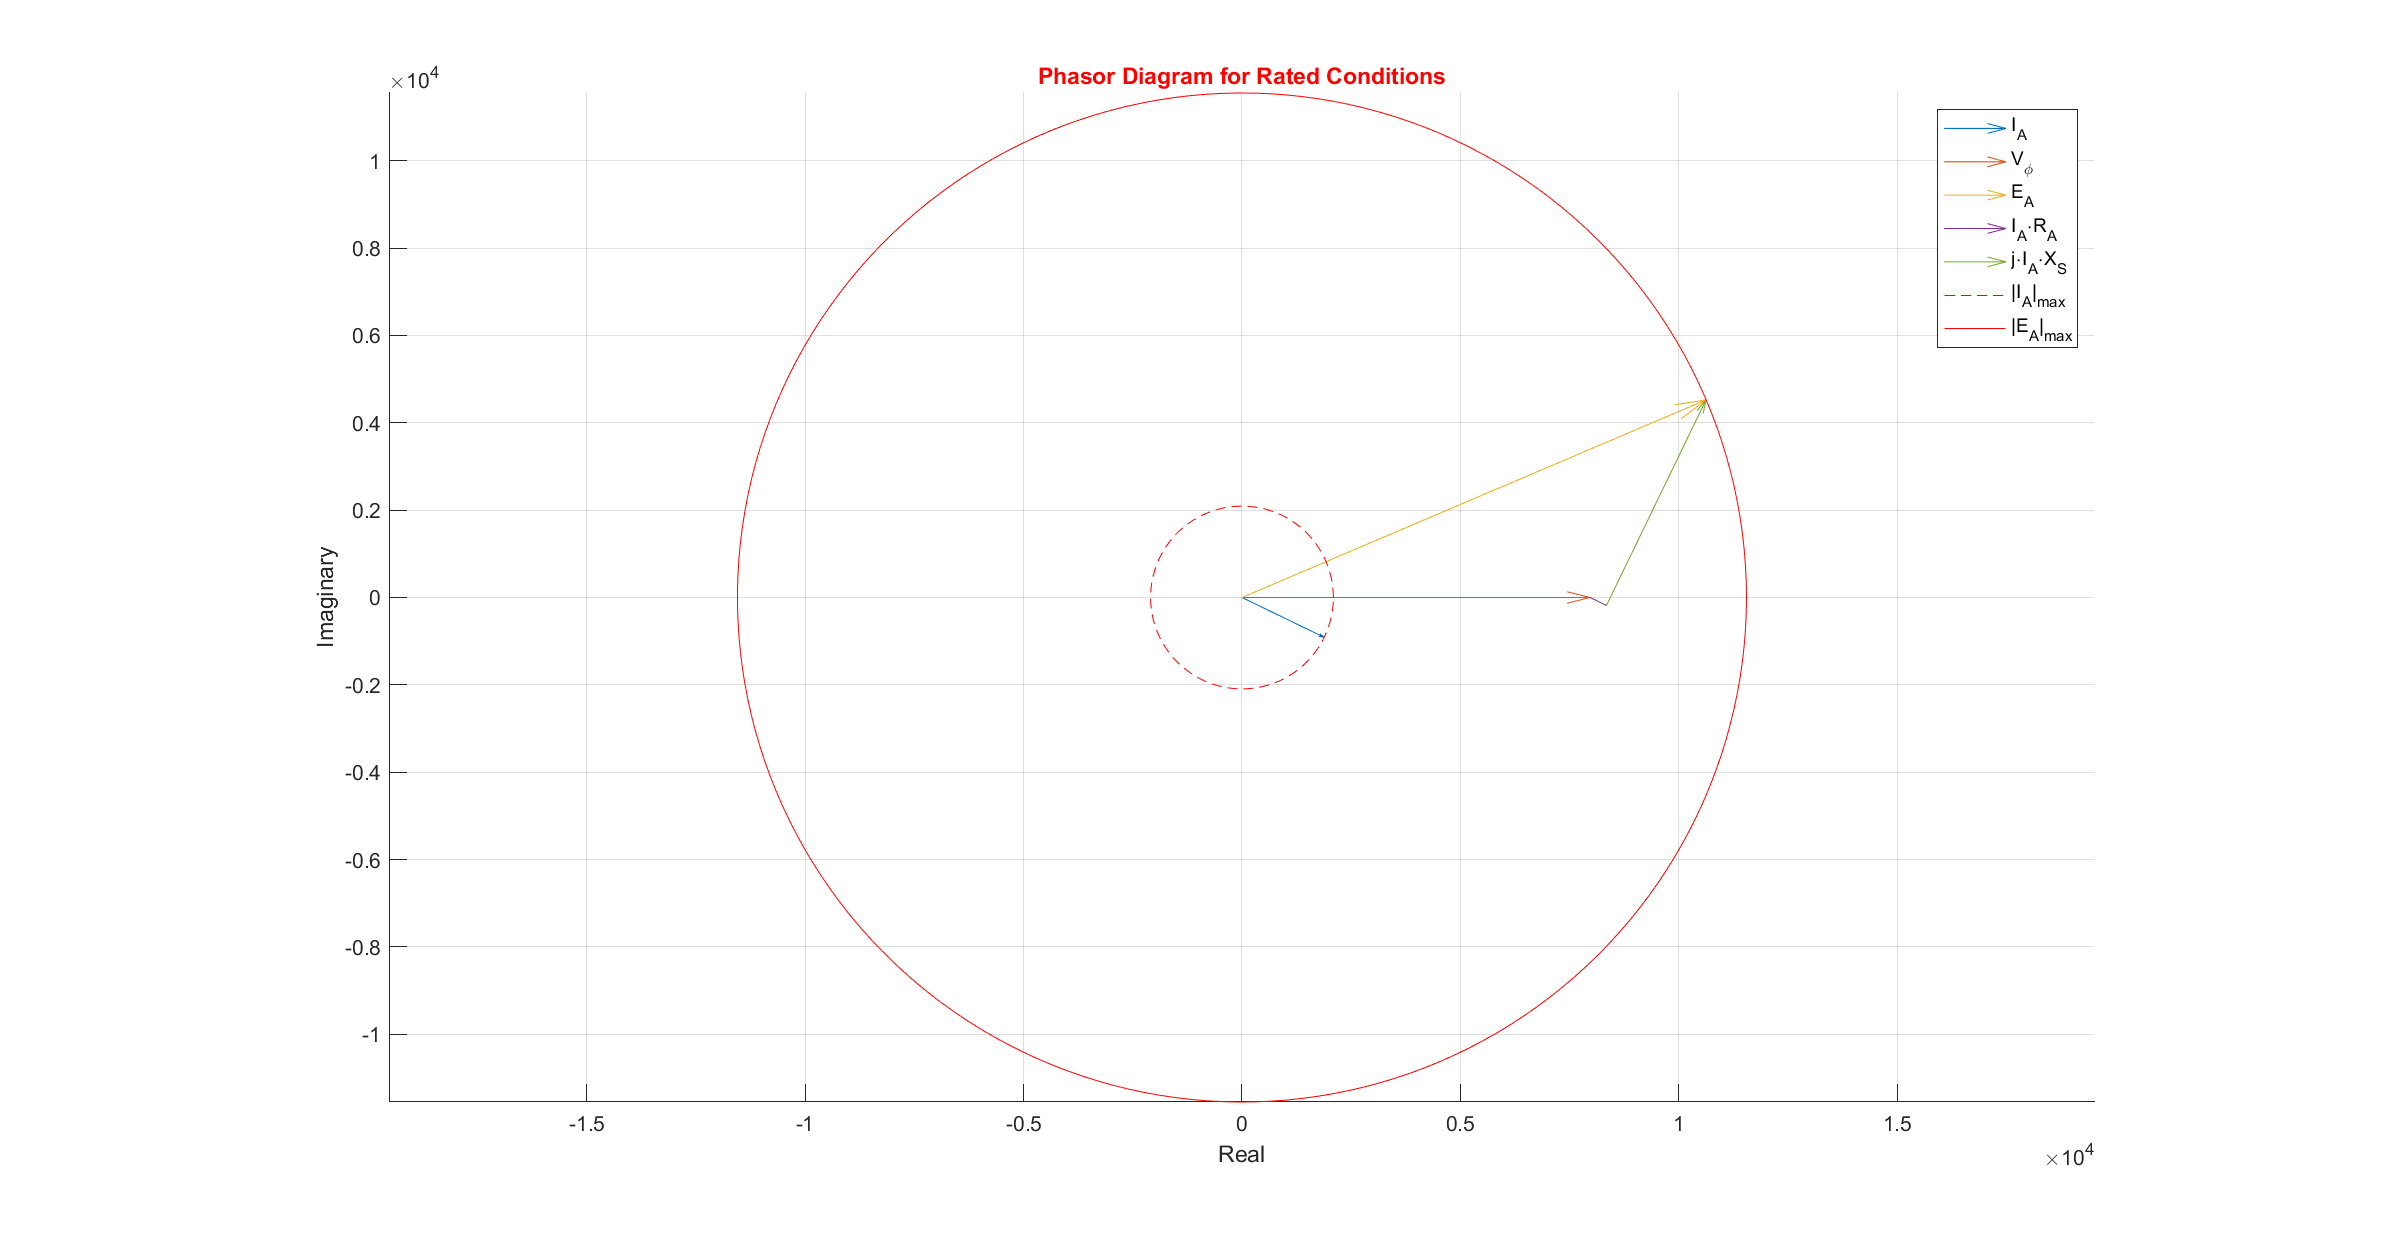
At rated conditions, compute and provide
and
. Explain briefly in your report theoretical calculations. For rated conditions plot the phasor diagram and limit circles of the appropriate variables in red. Include the plot in the report.
-
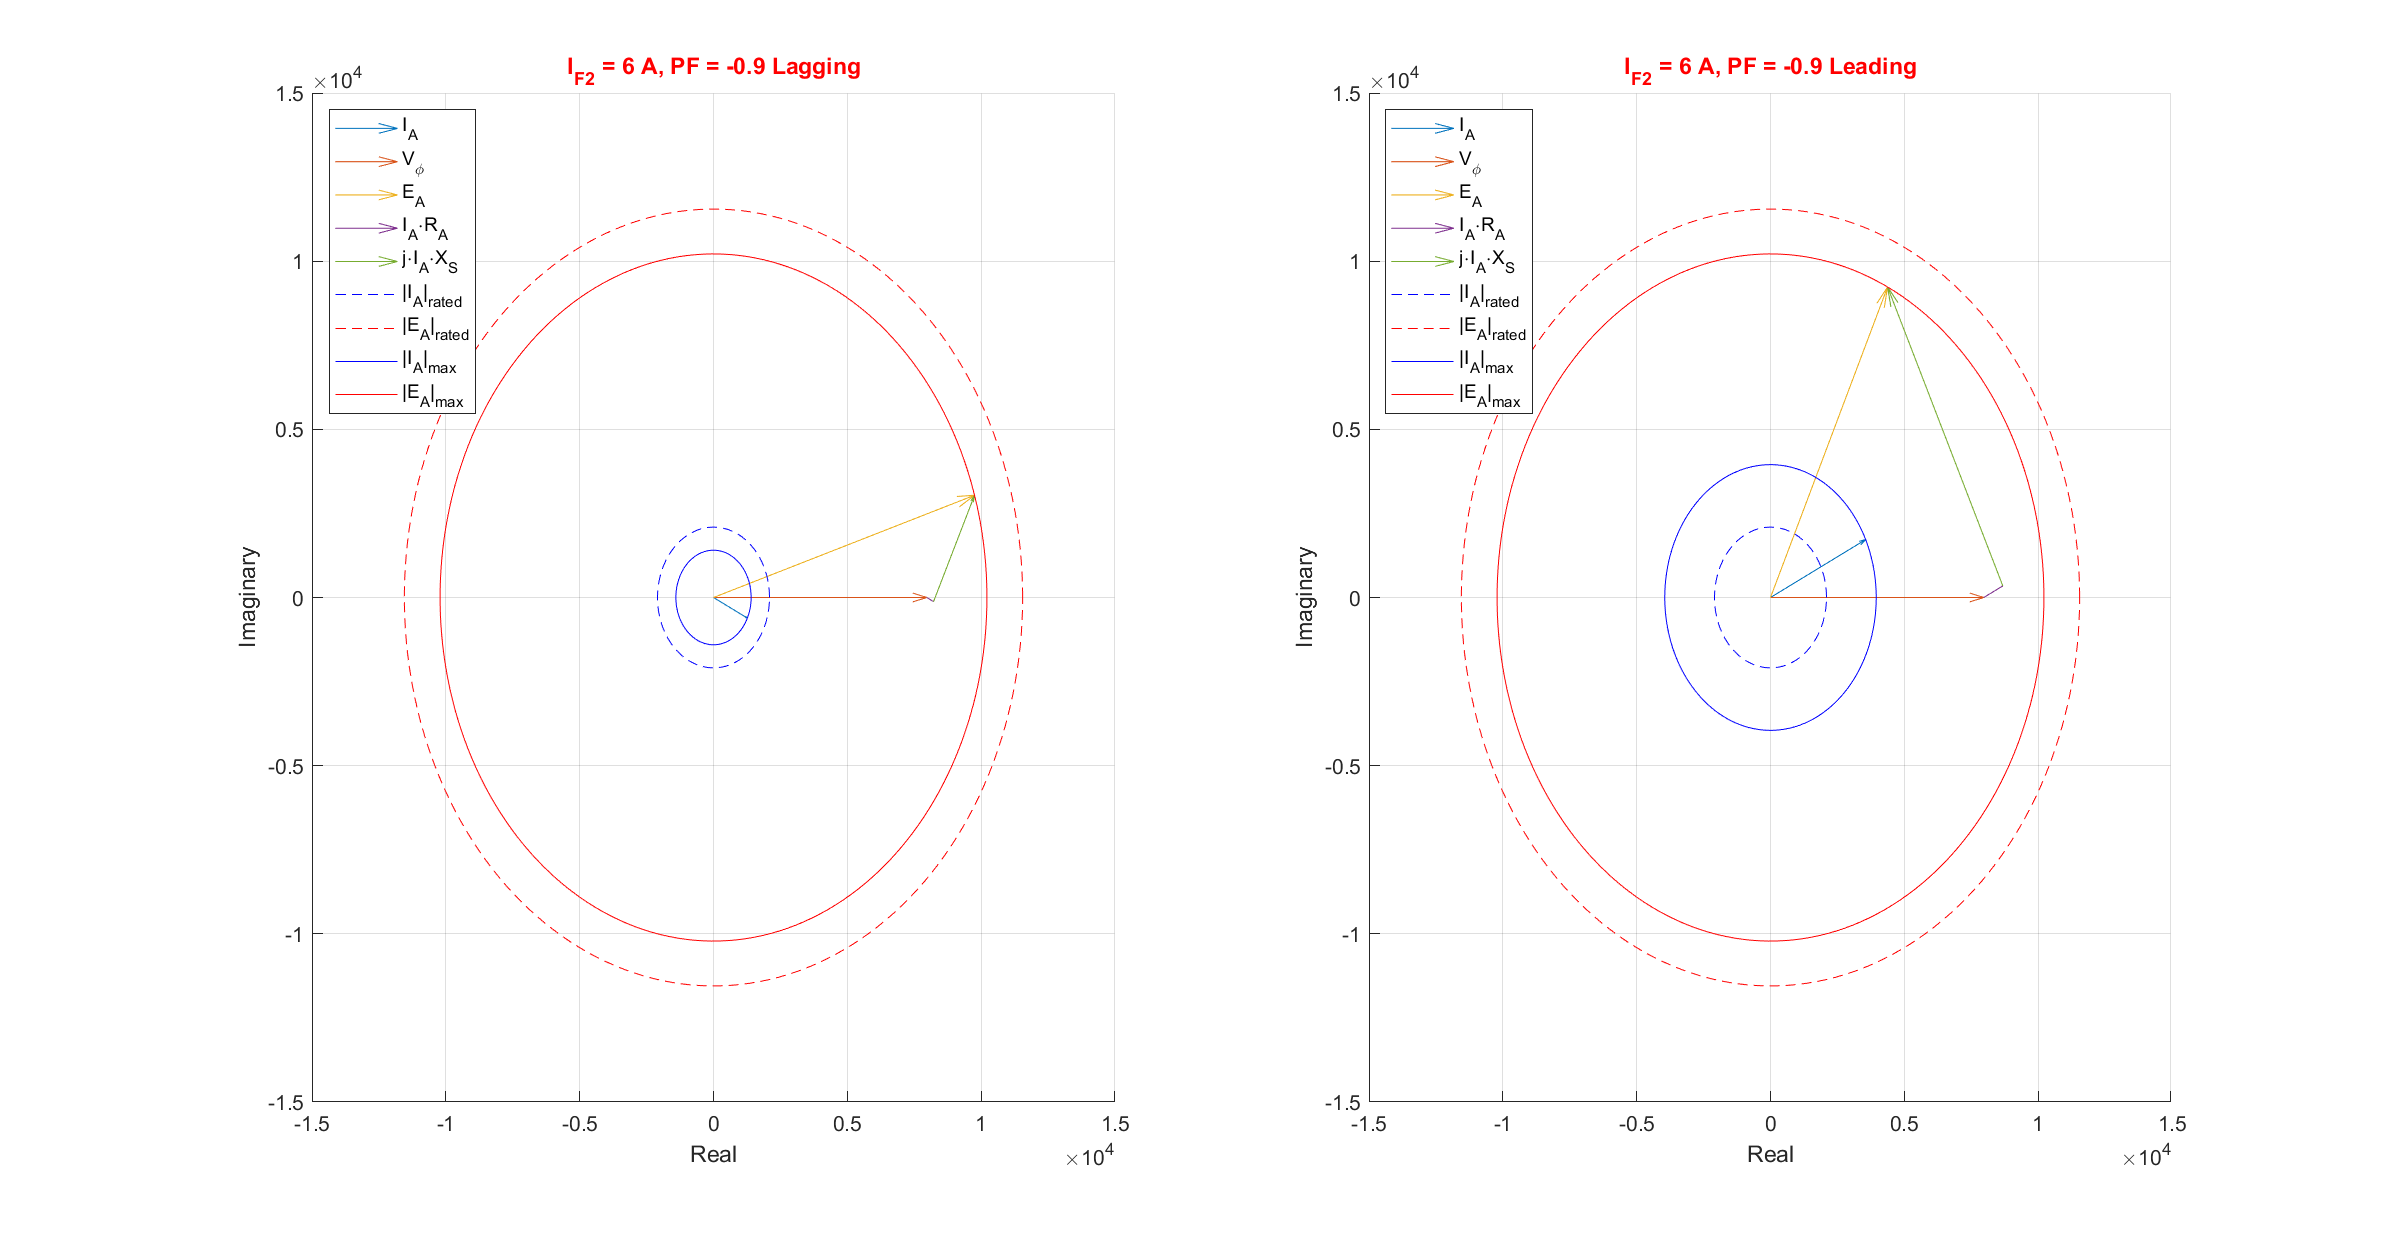
For this part, assume that the terminal voltage remains at the rated values described in the question. Create a new plot that contains the red limit circles. In this new figure, using different colors, the plot for 0.9–power–factor–lagging and 0.9–power–factor–leading
limit circles corresponding to
-
For each case when varying power factors and
👤 Aras Güngöre
- LinkedIn: @arasgungore
- GitHub: @arasgungore