Steve asked me to analyze a group of 12 green stocks to support his parent’s investment decisions. To do so, I gladly designed an interactive, user friendly, workbook using Visual Basic Application (VBA) within Excel to provide each stocks annual volume and return on investment (ROI).
He loved being able to analyze each stock at the click of a button and now wants to expand his research beyond the 12 green stocks.
Steve wants to analyze a higher number of stocks and I am here to help. This may increase the amount of time it takes the analysis to produce results and I’d like to maintain or, even better, improve it! Now I will take advantage of any opportunity to improve the workbooks efficiency by refactoring the VBA coding. To ensure that I am going in the right direction, I will compare the new execution time with the original workbook.
To make my code more efficient, I created 3 new arrays: -tickerVolumes(12) to hold volume -tickerStartingPrices(12) to hold starting price -tickerEndingPrices(12) to hold ending price
The above 3 arrays store performance data for each stock when a for loop runs analysis on them. The tickers array that I created in the original establishes a ticker symbol that can be called on for each stock.
Matching the 3 performance arrays with the ticker array is done by using a variable called the tickerIndex.
Now that I have created these arrays, I can use Nested For Loops and variables to loop through the data and complete the analysis.
See the Refactored vs Original coding below.
Sub AllStocksAnalysisRefactored()

    Dim startTime As Single
    Dim endTime  As Single

    yearValue = InputBox("What year would you like to run the analysis on?")

    startTime = Timer

    'Format the output sheet on All Stocks Analysis worksheet
    Worksheets("All Stocks Analysis").Activate

    'Title Analysis
    Range("A1").Value = "All Stocks (" + yearValue + ")"

    'Create a header row
    Cells(3, 1).Value = "Ticker"
    Cells(3, 2).Value = "Total Daily Volume"
    Cells(3, 3).Value = "Return"

    'Initialize array of all tickers
    Dim tickers(12) As String

    tickers(0) = "AY"
    tickers(1) = "CSIQ"
    tickers(2) = "DQ"
    tickers(3) = "ENPH"
    tickers(4) = "FSLR"
    tickers(5) = "HASI"
    tickers(6) = "JKS"
    tickers(7) = "RUN"
    tickers(8) = "SEDG"
    tickers(9) = "SPWR"
    tickers(10) = "TERP"
    tickers(11) = "VSLR"

    'Activate data worksheet
    Worksheets(yearValue).Activate

    'Count the number of rows to loop over
    RowCount = Cells(Rows.Count, "A").End(xlUp).Row

    '1a) Create a ticker index to reference proper ticker in the arrays.
    Dim tickerIndex As Integer
    'Initiate tickerIndex at zero.
    tickerIndex = 0


    '1b) Create three output arrays
    Dim tickerVolumes(12) As Long
    Dim tickerStartingPrices(12) As Single
    Dim tickerEndingPrices(12) As Single


    '2a) Create for loop to analyze each ticker in the array.
    For tickerIndex = 0 To 11
    'Initiate each ticker's volume at zero.
    tickerVolumes(tickerIndex) = 0

    'Activate data worksheet
    Worksheets(yearValue).Activate

        '2b) Loop over all the rows in the spreadsheet.
        For i = 2 To RowCount

            '3a) Increase volume for current ticker.
            tickerVolumes(tickerIndex) = tickerVolumes(tickerIndex) + Cells(i, 8).Value


            '3b) Check if the current row is the first row with the current ticker.

            If Cells(i, 1).Value = tickers(tickerIndex) And Cells(i - 1, 1).Value <> tickers(tickerIndex) Then
                'if it is the first row for current ticker, set starting price.
                tickerStartingPrices(tickerIndex) = Cells(i, 6).Value

            'End If
            End If


        '3c) Check if the current row is the last row with the current ticker.

            If Cells(i, 1).Value = tickers(tickerIndex) And Cells(i + 1, 1).Value <> tickers(tickerIndex) Then
                'if it is the last row for current ticker, set ending price.
                tickerEndingPrices(tickerIndex) = Cells(i, 6).Value

            'End if
            End If

        '3d) Check if the current row is the last row with the current ticker.
            If Cells(i, 1).Value = tickers(tickerIndex) And Cells(i + 1, 1).Value <> tickers(tickerIndex) Then

                'if it is, increase tickerIndex to move on to next ticker in array.
                tickerIndex = tickerIndex + 1

            'End If
            End If

        Next i

    Next tickerIndex

    '4) Loop through your arrays to output the Ticker, Total Daily Volume, and Return.

    For i = 0 To 11

        'Activate Output Worksheet
        Worksheets("All Stocks Analysis").Activate

        'Ticker Row Label
        Cells(4 + i, 1).Value = tickers(i)

        'Sum of Volume
        Cells(4 + i, 2).Value = tickerVolumes(i)

        'ReturnValue
        Cells(4 + i, 3).Value = tickerEndingPrices(i) / tickerStartingPrices(i) - 1


    Next i
Sub AllStocksAnalysis()

    Dim startTime As Single
    Dim endTime  As Single

    yearValue = InputBox("What year would you like to run the analysis on?")

    startTime = Timer

'1) Format the output sheet on All Stocks Analysis Worksheet

    'Activate "All Stocks Analysis" worksheet
    Worksheets("All Stocks Analysis").Activate

    'Title Analysis
    Range("A1").Value = "All Stocks (" + yearValue + ")"

    'Create a Header Row
    Cells(3, 1).Value = "Ticker"
    Cells(3, 2).Value = "Total Daily Volume"
    Cells(3, 3).Value = "Return"

'2)Initialize an array of all tickers.

    'Declare an array with 12 string elements
    Dim tickers(12) As String

        'Assign tickers to an element in the array
        tickers(0) = "AY"
        tickers(1) = "CSIQ"
        tickers(2) = "DQ"
        tickers(3) = "ENPH"
        tickers(4) = "FSLR"
        tickers(5) = "HASI"
        tickers(6) = "JKS"
        tickers(7) = "RUN"
        tickers(8) = "SEDG"
        tickers(9) = "SPWR"
        tickers(10) = "TERP"
        tickers(11) = "VSLR"

'3) Prepare for the analysis of all tickers.

    '3a) Initialize variables for the starting price and ending price.

        'Creating a Variable for Starting & Ending Price
        Dim startingPrice As Double
        Dim endingPrice As Double

    '3b) Activate the data worksheet.

        Worksheets(yearValue).Activate

    '3c) Find the number of rows to loop over.

        rowStart = 2
        'DELETE: rowEnd = 3013
        'rowCount code taken from https://stackoverflow.com/questions/18088729/row-count-where-data-exists
        RowCount = Cells(Rows.Count, "A").End(xlUp).Row

'4) Loop through the tickers.

    For i = 0 To 11
    ticker = tickers(i)
    totalVolume = 0

'5) Loop through the rows in the data.

        'Activate Data Worksheet
        Worksheets(yearValue).Activate

        For j = rowStart To RowCount


    '5a) Find the total volume for the current ticker.

            'Identify ticker
            If Cells(j, 1).Value = ticker Then

                'increase ticker totalVolume by the value in the current row
                totalVolume = totalVolume + Cells(j, 8).Value

            End If

    '5b) Find the starting price for the current ticker.

            'Identify first row of ticker
            If Cells(j, 1).Value = ticker And Cells(j - 1, 1).Value <> ticker Then
                'set starting price
                startingPrice = Cells(j, 6).Value

            End If

    '5c) find the ending price for the current ticker.

            'Identify last row of ticker
            If Cells(j, 1).Value = ticker And Cells(j + 1, 1).Value <> ticker Then
                'set ending price
                endingPrice = Cells(j, 6).Value

            End If

        Next j


'6) Output the data for the current ticker.

        'Activate Output Worksheet
        Worksheets("All Stocks Analysis").Activate

        'Ticker header
        Cells(i + 4, 1).Value = ticker

        'Sum of Volume
        Cells(i + 4, 2).Value = totalVolume

        'Return Value
        Cells(i + 4, 3).Value = endingPrice / startingPrice - 1

    Next i

        endTime = Timer
        MsgBox "This code ran in " & (endTime - startTime) & " seconds for the year " & (yearValue)


End Sub
There is a vast change in the 2017 performance of Green Stocks vs 2018. Only 2 of the 12 stocks, ENPH and RUN produced a positive ROI in both years. Many of the stocks also experiences a decline in volume.
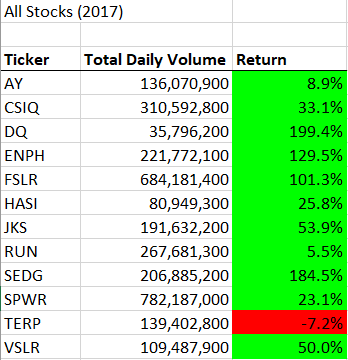
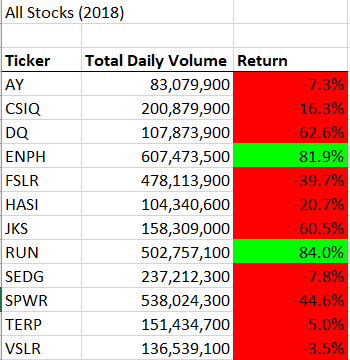
Steve should look at both economic and industry related influences before advising his parents on their investment decision. They may be better off looking at another industry.
Now lets see if the workbook can handle increasing the number of stocks analyzed.
Improving the efficiency of the code was a success! Execution time improved from 0.9433594 seconds to 0.1708984 seconds for 2017, and, 1.066406 to 0.1894531 for 2018. That’s an improvement of approximately 82% for each year.
Execution time for 2017 Original Coding

Execution time for 2017 Refactored Coding

Execution time for 2018 Original Coding

Execution time for 2018 Refactored Coding

The obvious advantage of refactoring code is that it makes it more efficient if you get it right. An 82% reduction in execution time can be huge if analyzing thousands of rows of data.
A huge risk with refactoring is that your errors may destroy an already working code. It is highly recommended that you save your original code and any changes you make frequently in case you run into any issues. That way you can always go back a step without needing to start completely over. I personally ran into issues during refactoring and found that using the msgBox script, as well as, testing performance outputs individually helped me identify what was driving my errors.