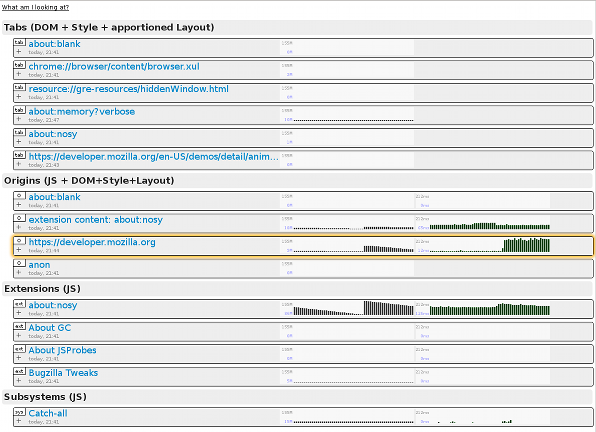
about:nosy looks like this:
Blog posts are at: http://www.visophyte.org/blog/tag/aboutnosy/
Current milestone: M4, having skipped M2 and M3.
M2 and M3 were skipped because:
- the GC probes were recently dumbed down; not sure of the fallout
- GC visualization is different from CPU usage which can just reuse the bars
- M1: Visualize DOM, JS memory on an aggregated origin basis. Reverse engineer the aggregation from the memory reporters. Sparkline area chart over time using a sampling interval, small multiples display.
- M2: w/jsprobes: show GC activity as either vertical markers or little arrows or something. (Global only for now, because we won't be able to relate compartments back yet.)
- M3: w/jsprobes: show per-compartment GC activity by enhancing jsprobes to be able to derive a compartment string like the one the memory reporters use.
- M4: w/jsprobes: show JS CPU usage as its own display by enhancing jsprobes to be able to provide a compartment string at major JS entry/exit crossings. No introduction of probes outside of the js/ tree, so if it needs DOM invoc changes we simply lose.
- M5 w/jsprobes: show reflow as its own per-origin display (maybe paint too?) by enhancing jsprobes to support probes outside the js/ sub-tree and adding the points into the reflow/etc. code.
- Optional detailed memory allocation mode where
JS_CreateObjectprobes are inserted which trigger some type of simple backtrace to find common allocation points and just how much memory they allocate. Requires a jsprobes enhancement to be able to capture backtraces. - Optional memory lifetime tracking that uses the existing object creation and finalization probes to show a timeline-smear for object lifetimes. No enhancements believed required unless the GC is compacting/copying, in which case we are boned.
- Add a way for JS code to intentionally cause a generic but parameterized probe to fire. For example, hook up to console.trace or something like that, and/or have the nsIProbeService expose something.
- General event loop probes, ideally augmented with causality chaining capabilities a la my systemtap probes. Which is to say, fire probes on event loop start/stop with at least the invocation pointers. Likewise, fire probes when events are scheduled, again possibly with the pointer. There are possible ways to make causality stuff more straightforward, but it's worth figuring out the useful use-cases first. Things like SpeedTracer and the WebKit timeline provide are probably the most useful; they would want a fresh id every time the user generates an event plus XHR that looks async or any websockets activity. We would want those id's to flow-through with a sub-field or other means of separating event loop turns. The higher-level bits of this may already exist or be planned by the devtools team, etc.
- mozStorage/SQLite probes, basically where telemetry does it but providing more detail. Seeing page I/O with page numbers would allow showing random access penalties and detect page churn that could be avoided by a larger cache size. Duration of statement execution is good, but being able to do something with opcode invocation counts could also be amazing.
- Crib from telemetry logging points.
- Crib from SPS (simple profiler) probe points.
- Crib from startup timeline/function timer points.