New issue
Have a question about this project? Sign up for a free GitHub account to open an issue and contact its maintainers and the community.
By clicking “Sign up for GitHub”, you agree to our terms of service and privacy statement. We’ll occasionally send you account related emails.
Already on GitHub? Sign in to your account
Tooltip Temporarily Combines data with mode:"x" and intersect:false #8293
Comments
|
You can set the mode to |
|
As @LeeLenaleee stated, setting the mode to |
|
Guess the issue should still be open since it is still definitly a bugg because it should only show the items intersecting on that X value and now it shows more items |
|
I'm guessing that this is due to the points being very close together and multiple points returning positive hit-tests. |
|
Also fixed by setting I'm closing as this is working as expected, the points should return positive hit-test with those parameters. |
|
With beta V3-beta-13 it does not a show any tooltip with Setting the mode to |
|
|
|
|
|
Any idea? I'm still having this issue with the latest release (3.2.0) |
|
@JEK58 are you looking for something like that: https://jsfiddle.net/svt7g0rn/ ? |
|
@kurkle almost. I would like to see the altitude of both pilots at the same time. |
|
@JEK58 your point skipping skipped different points so there were not many at the same timestamps. Without the skipping (and some other tuning): https://jsfiddle.net/svt7g0rn/5/ |
|
@kurkle unfortunately, even with Isn't there any way to only hover at "exact" x value? Mode |


Expected Behavior
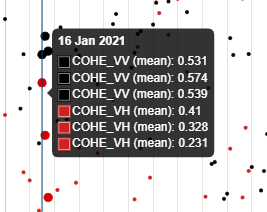
Tooltip should show the current axis intersect data correctly without what I can only describe as "render glitches".
Current Behavior
When moving your mouse over the x-axis, you can see that the tooltip will "flutter" at some points, showing data as if there's 3 or 4
datasetsinstead of just 2. They only last for a short duration, and then fade away on the next render loop.Possible Solution
Seems like something to do with how the intersect is being fetched is returning the wrong (or combined) result for some reason. Also note that there seems to be a related bug when you turn animations on in
options.hover(I turned them off). The issue seems to get much, much worse.Steps to Reproduce
https://jsfiddle.net/mclean25/0hdzsftk/15/
Context
It would be a very big UX improvement if the tooltip were to render nicely instead of looking like something breaks temporarily.
Environment
2.9.4The text was updated successfully, but these errors were encountered: