
|
|
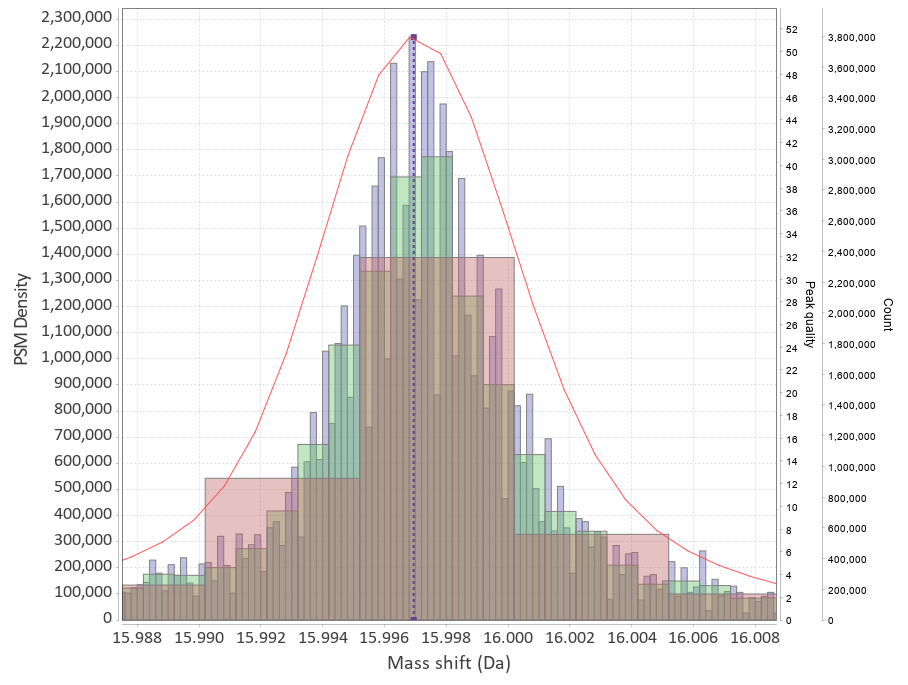
This program will plot mass-differences from a proteomic "Open Search". An "Open Search" is any search of fragmentation spectra (MS2) against a protein database when the precursor mass tolerance was set to a high enough value. E.g. not the usual 5-10-20 ppm, but instead 50-100-200 Da. The result of such a search is quite different from the regular one, it might contain a lot of spurious hits, but a lot of hits will still correspond to reasonable matches.
The differences in mass between the observed value for a precursor and the theoretical peptide mass from a database might be many Daltons. Nevertheless, you'll still see lots of similar mass differences, which should correspond to Post Translational Modifications (PTMs) or chemical modifications or other artifacts in the data.
After performing an Open Search you might want to identify the differences to maybe include them into the variable modifications list of your search engine settings. You might also discover unexpected artifacts, like chemical derivatives of peptides occurring because of your sample preparation protocols etc.
This is where this program comes into play.
Download the jar file from the Releases section.
- On Windows you can just start the
.exefile from the Downloads. - Run
java -jar deltamass-x.x.jar guito launch the GUI. You might want to include a JVM switch-Xmx2G(change the number to the amount of gigabytes of memory you'll allow the process to consume), so the command becomes:
java -jar -Xmx2G deltamass-x.x.jar gui
Run java -jar deltamass-x.x.jar to see the help, it will print available commands.
To print help/usage for a specific command add command -h, e.g.
java -jar deltamass-x.x.jar peaks -h
There are quite a few options there and it might seem overwhelming at
first, so you might want to try the GUI version first.
- Left Mouse Button = LMB, Right Mouse Button = RMB.
- Zoom -
LMB drag to the right. Zooms in mass axis, Y-axis automatically adjusts to fit all peaks. Or useMouse Wheel. Check context menu options to change the behavior. - Un-zoom -
LMB drag to the left. Unzooms the mass axis completely, BUT keeps the current Y axis zoom. To restore Y-axis zoom as well useMouse Wheelonce after full zoom out. You can useMouse Wheelto zoom out. - Pan -
Hold Ctrl + LMB drag. WIll pan X axis only, moving the view left and right. Mouse Wheel- zoom in/out onto the X point currently under cursor.LMB click- Selection. Places two vertical guides to denote the region currently displayed in the Info Window. The Info Window will list known modifications in this range of masses and also list peptides from your search results that fall into this range.RMB click- options for the plot (Preferences), you can also save the plot from here (prefer saving to PNG) and change how zooming works.
If you have used this software in your work or research, please cite:
| Manuscript | Dmitry M. Avtonomov, Andy Kong, and Alexey I. Nesvizhskii, "DeltaMass: Automated Detection and Visualization of Mass Shifts in Proteomic Open-Search Results". J. Proteome Res., 2019, 18 (2), pp 715–720 |
| DOI | 10.1021/acs.jproteome.8b00728 |
| BibTex |
 @article{Avtonomov2019,
  author = {Avtonomov, Dmitry M. and Kong, Andy and Nesvizhskii, Alexey I.},
  title = {DeltaMass: Automated Detection and Visualization of Mass Shifts in Proteomic Open-Search Results},
  journal = {J. Proteome Res.},
  publisher = {American Chemical Society},
  year = {2019},
  volume = {18},
  number = {2},
  pages = {715--720},
  url = {https://doi.org/10.1021/acs.jproteome.8b00728},
  doi = {https://doi.org/10.1021/acs.jproteome.8b00728}
}
|