Airbnb, short for “Air Bed and Breakfast”, is a well-known service that enables property owners to rent out their homes, apartments or individual rooms to travelers looking for alternatives to conventional hotels. Since its establishment in 2008, Airbnb now operates in more than 220 countries with over 4 million listings (Airbnb, n.d.). The platform has created a new form of accommodation that is frequently less costly and more adaptable than traditional options. Nonetheless, Airbnb prices can vary based on different factors such as the area, time of year, and demand.
International public holidays such as Christmas, New Year’s and Easter are known for the immense amount of people traveling back and forth - either on national territory or flying to certain destinations - to spend the holidays with their families and friends. Moreover, travelers often find themselves in a position where they need to book hotel rooms, apartments or villas to be able to take part in these yearly celebrations along with their loved ones, sometimes seeking cheaper options. According to statistics from Airbnb (2015) and Kayak (2019, a travel booking platform, New York, Paris and Amsterdam have been found to be among the top 15 most popular destinations in the world between Christmas and New Years.
How does the Airbnb room price change in New York, Paris, and Amsterdam between Christmas and New Year and over the Easter period in 2023, and do the price fluctuations during holiday periods vary depending on room type, superhost status, number of accommodates?
| Variables | Description |
|---|---|
| Price | Room price in New York, Paris and Amsterdam is treated as predicted variable |
| Dates | The dates during Christmas, New Year and Easter: 22 December - 3 January & 6 April – 12 April |
| City | Three popular destinations during public holidays: New York, Paris and Amsterdam |
| Host_is_superhost | Whether the host is verified as super host |
| Room_type | If the room is "entire home/apt", "private room", "share room" or "hotel room" |
| Accommodates | Number of tenants that can be accommodated |
The data was downloaded from the Inside Airbnb website (http://insideairbnb.com/get-the-data). Accordingly, the calendar and reviews csv files were downloaded into R for Amsterdam, Paris and New York. ANOVA was chosen as an appropriate analysis method as we are looking for a causal(dependence) relationship between listings prices during Easter, Christmas and New Year's, and whether these price fluctiations vary depending on the type of room, superhosy status and the number of people that can be accomodated. For prototyping purposes, only 100000 were taken for the analyses, as generally very broad samples tend to give significance, despite the impact not being big.
This study could provide Airbnb hosts with pricing strategies during public holidays, which could potentially lead to increased earnings for them. On the other hand, the study could prove to be useful to tourists themselves, as they might be able to observe certain price increases or price differences between listings and the drivers behind the variations or price surges. Lastly, the analysis could become a basis for future academic research or integration in academic literature on the relationship between holidays and tourism.
- src
- analysis
- makefile
- analyze.R
- data-preparation
- makefile
- calendar_datasets.R
- city_datasets.R
- data_exploration.Rmd
- data_exploration.pdf
- download_data.R
- install.packages.R
- clean-up.R
- analysis
- .gitignore
- README.md
- makefile
Folow this guide to install R Make sure you run the following commands to install the following packages in RStudio:
install.packages("tidyverse")
install.packages("readr")
install.packages("dplyr")
install.packages("ggplot2")
install.packages(“knitr”)
install.packages(“gridExtra”)
install.packages(“kableExtra”)- Open GitBash
- Change the working directory to your preferred location
- Type
git clone https://github.com/course-dprep/airbnb-price-changes-during-public-holidays
- Change working directory to
airbnb-price-changes-during-public-holidays - Type
make
The ANOVA outputs can be found below with interpretations per city
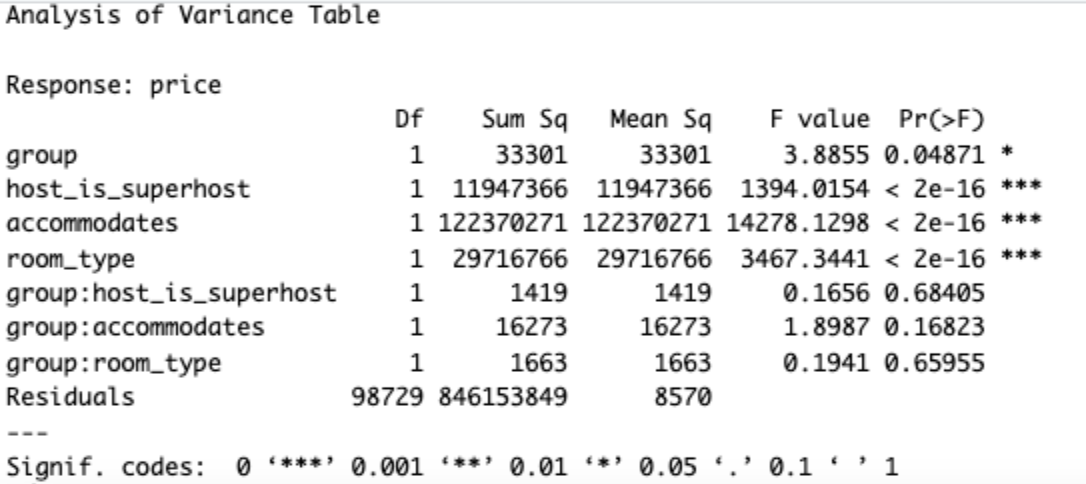
We will turn our attention to the significance column (Pr(>F)), as it is the measure that will show the evidence of our hypothesis (the price fluctuations vary across the number of people that can be accommodates, the type of room and whether the host_is_a-superhost).
The first thing we notice is that the output shows that prices fluctuate during the holiday periods, at the p-value of the group variable shows significance (<0.05). Furthermore, by looking at the significance levels of host_is_superhost, accomodates and room_type, we can conclude that they all influence prices, as their p-values are very close to 0 (<0.0001). However, when turning our attention to their interaction with the holiday periods, there is no significance, therefore there is no evidence suggesting that these characteristics, during holidays, influence the prices of Airbnb rooms.
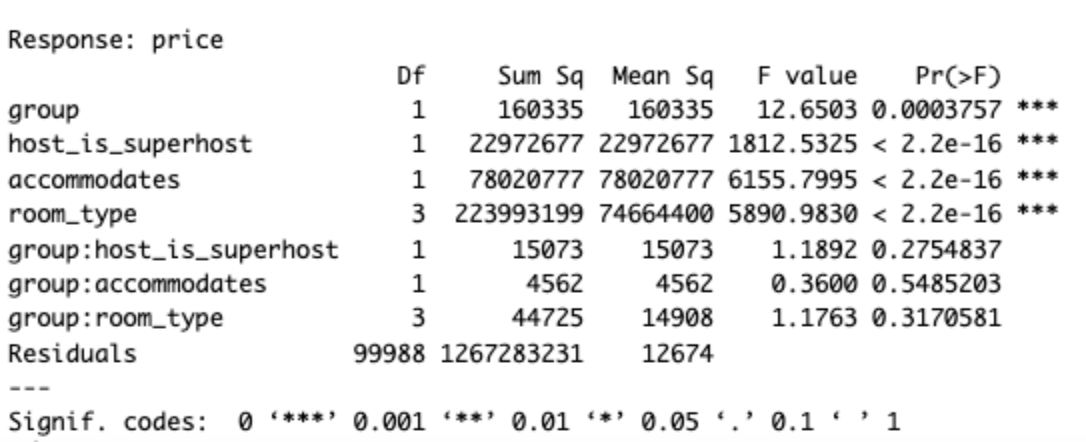
Again, we turn our attention to the significance column (Pr(>F)).The ANOVA analysis indicates that the number of people that can be accommodated (accomodates) (p < 0.001) and the type of room (room_type) (p < 0.001) significantly affect Airbnb room prices during the Christmas, New Year and Easter periods in Amsterdam. However, the predictor variables of city (city), superhost status (host_is_superhost), and their interactions with other variables did not have a significant impact on room prices. Here, the variable group:host_is_superhost has a p-value of 0.27548, which means that it is not statistically significant at the 0.05 level. Therefore, there is no evidence to suggest that this variable has a significant effect on the continuous variable being analyzed. Similarly, the variable group:accommodates also has a p-value greater than 0.05 (p-value=0.54852), indicating that it is not statistically significant* at the 0.05 level and has no significant effect on the continuous variable being analyzed. The interaction variable group:room_type also fails to show statistical significance as its p-value of 0.3170581 is greater than the significance level of 0.05.
Hence, there is no strong evidence to suggest that this interaction variable has a significant effect on the continuous variable being analyzed.
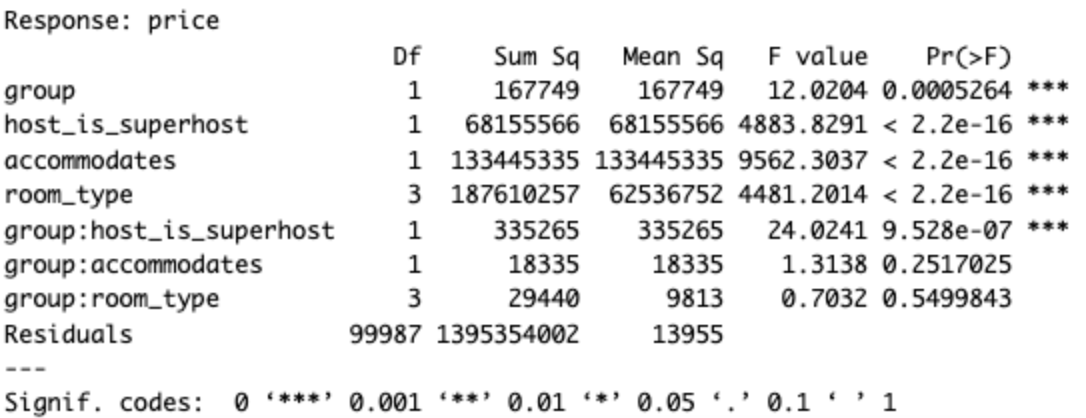
Regarding the New York dataset, when looking at the interaction between the group of dates and whether it is a superhost (group:host_is_superhost), the P-value is much smaller than 0.05, which represents the effect of different dates (holidays and normal days) on prices significantly depending on whether the room host is a superhost. However, the impact of dates on price is not really related to the number of people that can be accommodates (accomodates) and the type of room (room_type), since their p-value are 0.252 and 0.550 respectively.
For the main research question whether prices fluctuate in holidays compared to normal days, ANOVA table shows there is indeed a significant difference between holidays and normal days because of a very small p-value with 0.001. Moreover, the Airbnb prices also significantly differ between whether the host is a superhost, the number of people that can be accommodates and the type of rooms, which are concluded from their much smaller p-values compared with 0.05.
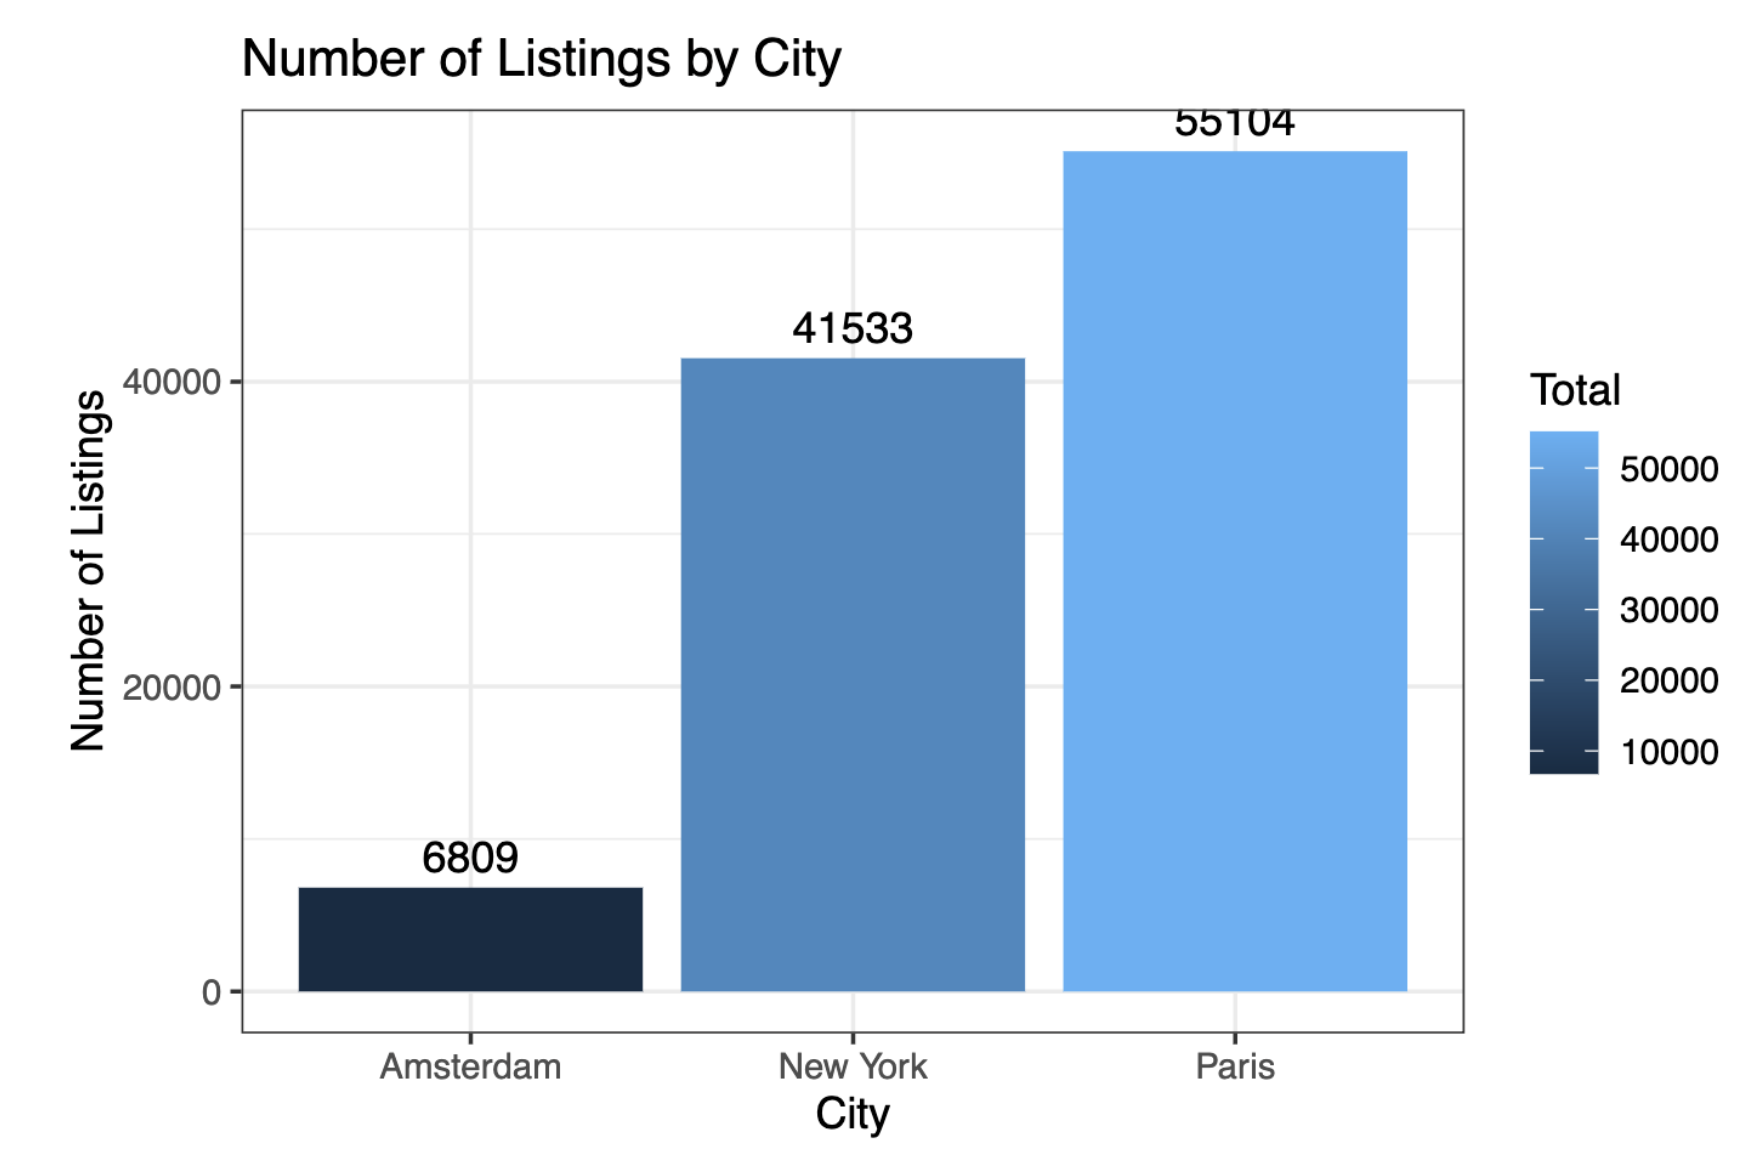 The bar chart highlights a difference in the number of listings in each city, with Amsterdam having the lowest number of listings. On the other end, Paris has the highest number of listings and New York falls in between the two in terms of the number of listings.
Being a 'Super Host' on Airbnb is typically a positive indicator to potential customers as the listing can be trusted due to a number of factors, including previous positive experiences by other customers, a high response rate, among others.
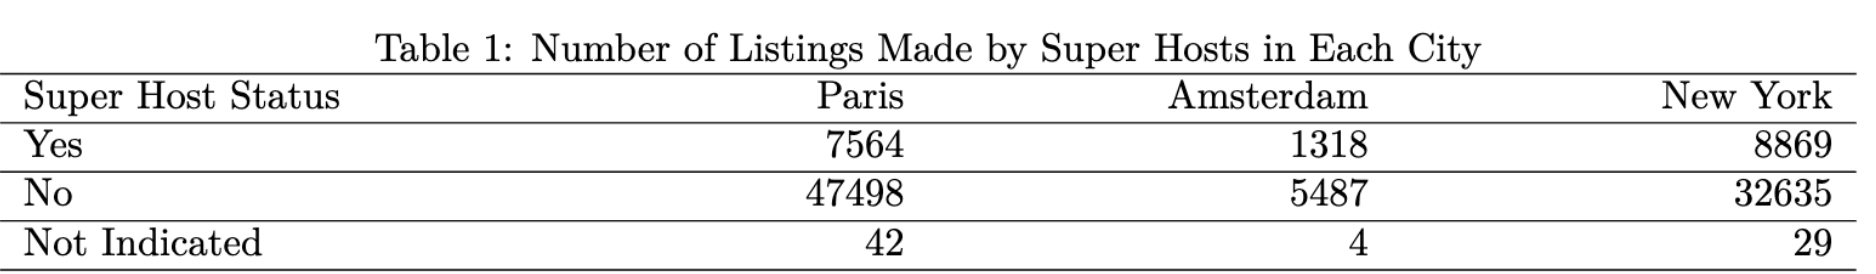 The number of listings that are made by a super host in each city evidently make up just a fraction of the total number of listings, which is as expected as the super host tag is only awarded to the most reputable hosts on the platform. Interestingly, the percentage of listings made by super hosts in Amsterdam and New York is approximately 20% of the total listings, whereas in Paris, this percentage is relatively lower.
The number of guests that a particular Airbnb can accommodate is also relevant to potential consumers when searching on the platform.
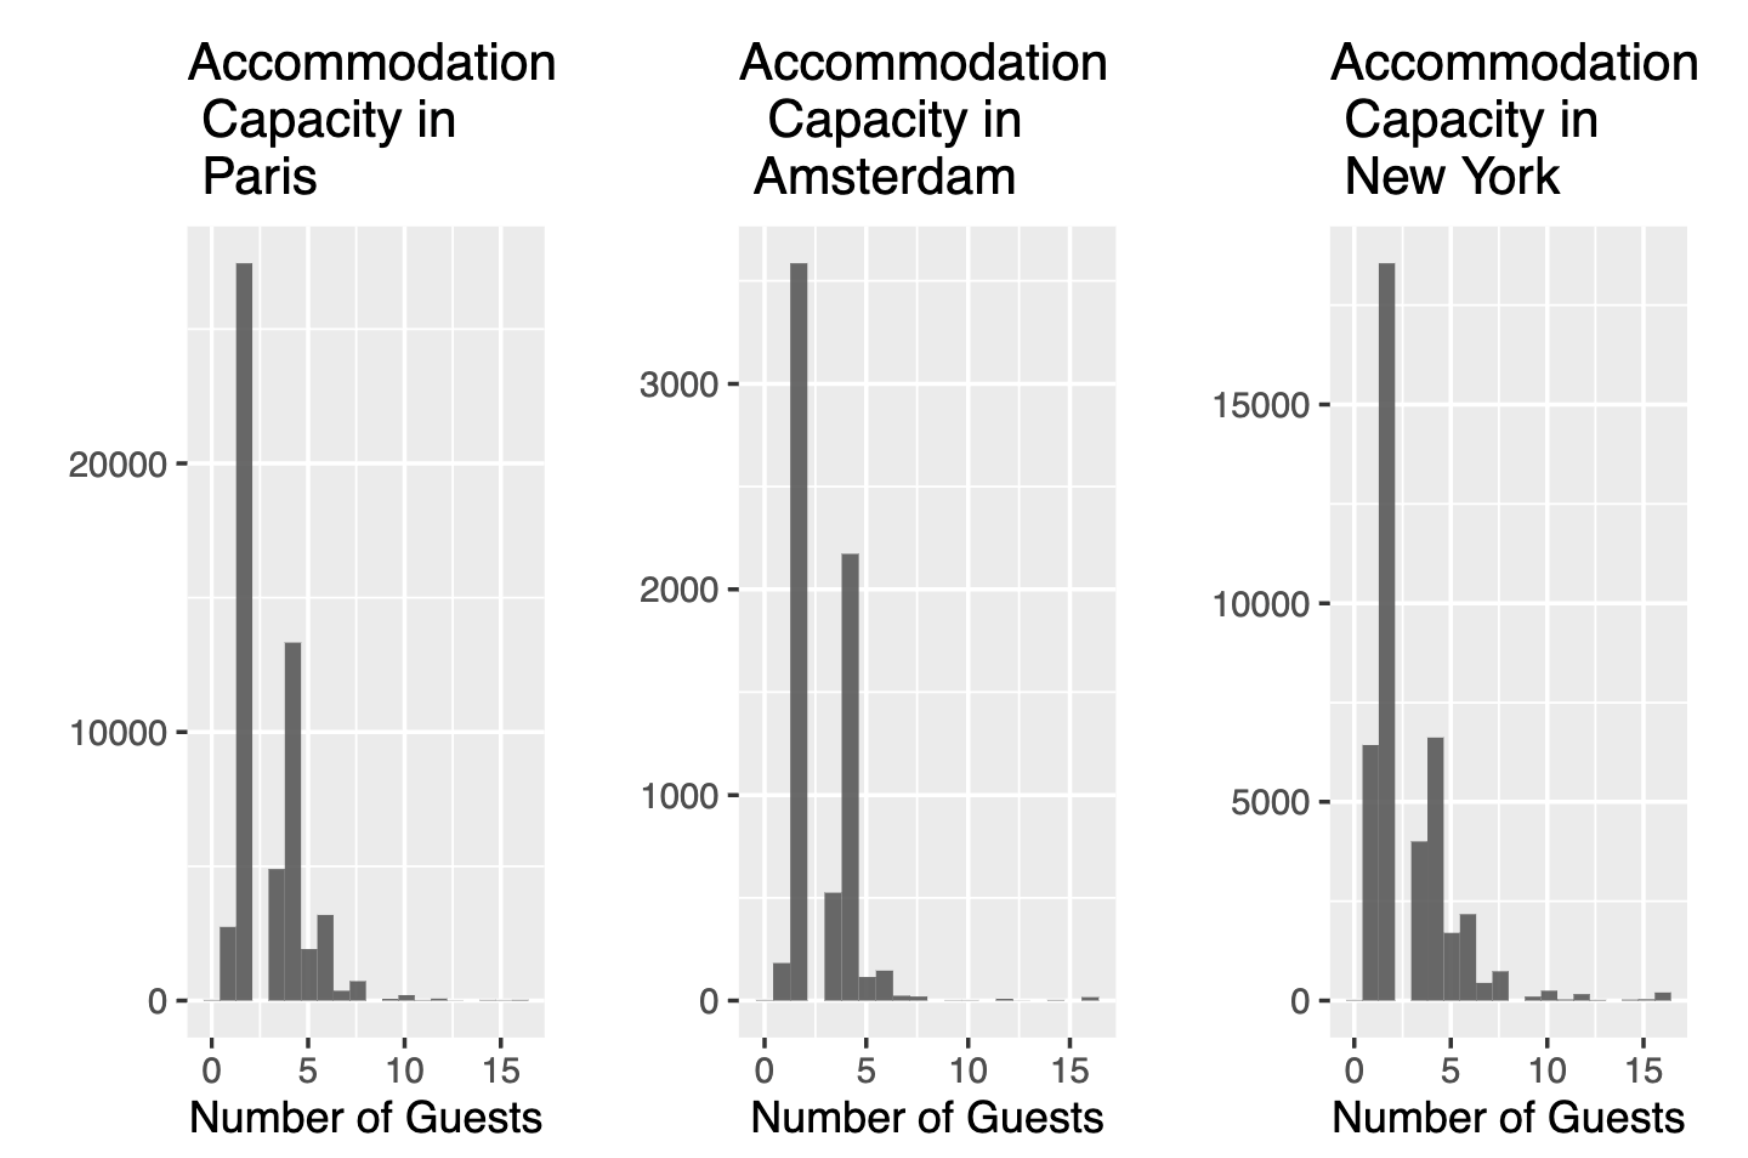 The histograms indicate that a majority of listings, across the three cities, can accommodate less than 5 guests. There are listings, however, that are able to host larger groups, especially in New York compared to Amsterdam and Paris.
The main conclusions that can be drawn from our analyses, and that consumers can take into account when choosing to go to Paris, New York or Amsterdam are:
- Christmas, New Year's and Easter significantly impact the prices of rooms in Amsterdam, Paris and New York.
- The superhost status, the type of room and the number of people that can be accommodated all impact the prices of Airbnb rooms.
- The aforementioned impact is not significant during the 3 holiday periods, therefore the prices do not fluctate due to the influence of room type, the superhost status and the number of people that can be accommodated.
- Paris has the highest number of listings.
- New York has the highest number of superhosts.
- On average, New York is able to accommodate bigger group (>5 people) compared to Amsterdam and Paris.
- Yufan Wang (y.wang_34@tilburguniversity.edu)
- Bas van Houten (b.a.vanhouten@tilburguniversity.edu)
- Karan Lalchandani (k.j.lalchandani@tilburguniversity.edu)
- My Ni Tran (m.n.tran@tilburguniversity.edu)
- Elly Dinescu (e.dinescu@tilburguniversity.edu)