Here you can find the materials for the "Data Engineering 3: Batch Jobs and APIs" course, part of the MSc in Business Analytics at CEU. For the previous editions, see 2017/2018, 2018/2019, 2019/2020, 2020/2021, 2021/2022, 2022/2023.
2 x 3 x 100 mins on March 20 and 27:
- 13:30 - 15:10 session 1
- 15:10 - 15:40 break
- 15:40 - 17:20 session 2
- 17:20 - 17:40 break
- 17:40 - 19:20 session 3
In-person at the Vienna campus (QS B-421).
Please find in the syllabus folder of this repository.
- You need a laptop with any operating system and stable Internet connection.
- Please make sure that Internet/network firewall rules are not limiting your access to unusual ports (e.g. 22, 8787, 8080, 8000), as we will heavily use these in the class (can be a problem on a company network). CEU WiFi should have the related firewall rules applied for the class.
- Please install Slack, and join the #ba-de3-2023 channel in the
ceu-bizanalyticsgroup. - When joining remotely, it's highly suggested to get a second monitor where you can follow the online stream, and keep your main monitor for your own work. The second monitor could be an external screen attached to your laptop, e.g. a TV, monitor, projector, but if you don't have access to one, you may also use a tablet or phone to dial-in to the Zoom call.
Will be updated from week to week.
Goal: learn how to run and schedule R jobs in the cloud.
Excerpts from https://daroczig.github.io/talks
- "A Decade of Using R in Production" (Real Data Science USA - R meetup)
- "Getting Things Logged" (RStudio::conf 2020)
- "Analytics databases in a startup environment: beyond MySQL and Spark" (Budapest Data Forum 2018)
-
Use the following sign-in URL to access the class AWS account: https://657609838022.signin.aws.amazon.com/console
-
Secure your access key(s), other credentials and any login information ...
... because a truly wise person learns from the mistakes of others!
"When I woke up the next morning, I had four emails and a missed phone call from Amazon AWS - something about 140 servers running on my AWS account, mining Bitcoin" -- Hoffman said
"Nevertheless, now I know that Bitcoin can be mined with SQL, which is priceless ;-)" -- Uri Shaked
So set up 2FA (go to IAM / Users / username / Security credentials / Assigned MFA device): https://console.aws.amazon.com/iam
PS probably you do not really need to store any access keys, but you may rely on roles (and the Key Management Service, and the Secrets Manager and so on)
-
Let's use the
eu-west-1Ireland region
-
Create an EC2 instance
- Optional: create an Elastic IP for your box
- Go the the Instances overview at https://eu-west-1.console.aws.amazon.com/ec2/v2/home?region=eu-west-1#Instances:sort=instanceId
- Click "Launch Instance"
- Provide a name for your server (e.g.
daroczig-de3-week1) and some additional tags for resource tracking, including tagging downstream services, such as Instance and Volumes:- Class:
DE3 - Owner:
daroczig
- Class:
- Pick the
Ubuntu Server 22.04 LTS (HVM), SSD Volume TypeAMI - Pick
t3a.small(2 GiB of RAM should be enough for most tasks) instance type (see more instance types) - Select your AWS key created above and launch
- Pick a unique name for the security group after clicking "Edit" on the "Network settings"
- Click "Launch instance"
- Note and click on the instance id
-
Connect to the box
- Specify the hostname or IP address
- Specify the "Private key file for authentication" in the Connection category's SSH/Auth/Credentials pane
- Set the username to
ubuntuon the Connection/Data tab - Save the Session profile
- Click the "Open" button
- Accept & cache server's host key
Alternatively, you can connect via a standard SSH client on a Mac or Linux, something like:
chmod 0400 /path/to/your/pem
ssh -i /path/to/your/pem -p 8000 ubuntu@ip-address-of-your-machine
As a last resort, use "EC2 Instance Connect" from the EC2 dashboard by clicking "Connect" in the context menu of the instance (triggered by right click in the table).
-
Look at the docs: https://www.rstudio.com/products/rstudio/download-server
-
First, we will upgrade the system to the most recent version of the already installed packages. Note, check on the concept of a package manager!
Download Ubuntu
aptpackage list:sudo apt update
Optionally upgrade the system:
sudo apt upgrade
And optionally also reboot so that kernel upgrades can take effect.
-
Install R
sudo apt install r-base
To avoid manually answering "Yes" to the question to confirm installation, you can specify the
-yflag:sudo apt install -y r-base
-
Try R
R
For example:
1 + 4
hist(mtcars$hp)
# duh, where is the plot?!
Exit:
q()
Look at the files:
ls
ls -latr
-
Install RStudio Server
wget https://download2.rstudio.org/server/jammy/amd64/rstudio-server-2023.12.1-402-amd64.deb
sudo apt install -y gdebi-core
sudo gdebi rstudio-server-2023.12.1-402-amd64.deb
-
Check process and open ports
rstudio-server status
sudo rstudio-server status
sudo systemctl status rstudio-server
sudo ps aux | grep rstudio

sudo apt -y install net-tools
sudo netstat -tapen | grep LIST
sudo netstat -tapen
-
Look at the docs: http://docs.rstudio.com/ide/server-pro/
-
Confirm that the service is up and running and the port is open
ubuntu@ip-172-31-12-150:~$ sudo netstat -tapen | grep LIST
tcp        0      0 0.0.0.0:8787            0.0.0.0:*               LISTEN      0          49065       23587/rserver
tcp        0      0 0.0.0.0:22              0.0.0.0:*               LISTEN      0          15671       1305/sshd
tcp6       0      0 :::22                   :::*                    LISTEN      0          15673       1305/sshd
-
Try to connect to the host from a browser on port 8787, eg http://foobar.eu-west-1.compute.amazonaws.com:8787
-
Realize it's not working
-
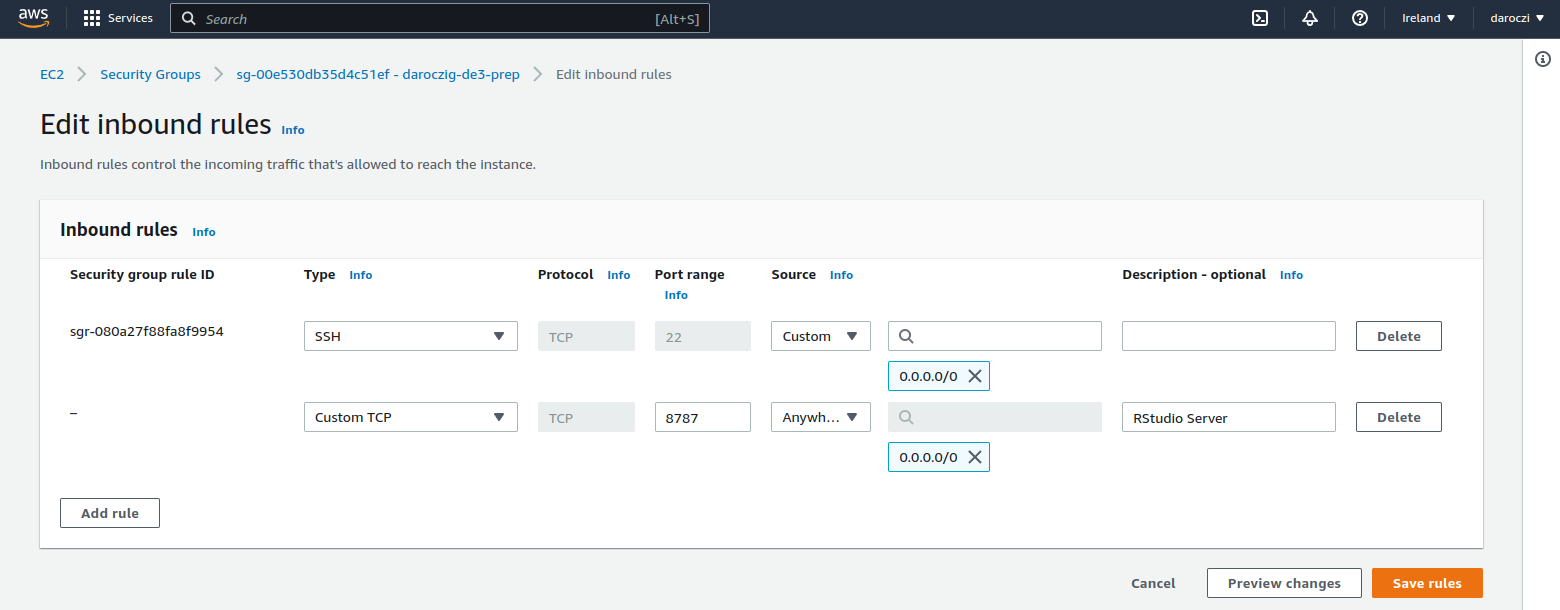
Open up port 8787 in the security group, by selecting your security group and click "Edit inbound rules":
-
Authentication: http://docs.rstudio.com/ide/server-pro/authenticating-users.html
-
Create a new user:
sudo adduser ceu -
Login & quick demo:
1+2
plot(mtcars)
install.packages('fortunes')
library(fortunes)
fortune()
fortune(200)
system('whoami')
-
Reload webpage (F5), realize we continue where we left the browser :)
-
Demo the terminal:
$ whoami
ceu
$ sudo whoami
ceu is not in the sudoers file.  This incident will be reported.
-
Grant sudo access to the new user by going back to SSH with
rootaccess:sudo apt install -y mc sudo mc sudo mcedit /etc/sudoers sudo adduser ceu admin man adduser man deluser
Note 1: might need to relogin / restart RStudio / reload R / reload page .. to force a new shell login so that the updated group setting is applied
Note 2: you might want to add NOPASSWD to the sudoers file:
```sh
ceu ALL=(ALL) NOPASSWD:ALL
```
Although also note (3) the related security risks.
-
Custom login page: http://docs.rstudio.com/ide/server-pro/authenticating-users.html#customizing-the-sign-in-page
-
Custom port (e.g. 80): http://docs.rstudio.com/ide/server-pro/access-and-security.html#network-port-and-address
echo "www-port=80" | sudo tee -a /etc/rstudio/rserver.conf
sudo rstudio-server restart
-
Note the pretty outdated R version ... so let's update R:
wget -qO- https://cloud.r-project.org/bin/linux/ubuntu/marutter_pubkey.asc | sudo tee -a /etc/apt/trusted.gpg.d/cran_ubuntu_key.asc
sudo add-apt-repository "deb https://cloud.r-project.org/bin/linux/ubuntu $(lsb_release -cs)-cran40/"

## fetch most recent list of packages and version, then auto-upgrade
sudo apt-get update && sudo apt-get -y upgrade
Now try R in the console, then restart R in RStudio (Session/Quit Session). Also a good time to clean up the Terminal (brush icon in the top right of the panel).
-
Installing packages:
## don't do this at this point!
## install.packages('ggplot2')
-
Use binary packages instead as per https://github.com/eddelbuettel/r2u
wget -q -O- https://eddelbuettel.github.io/r2u/assets/dirk_eddelbuettel_key.asc | sudo tee -a /etc/apt/trusted.gpg.d/cranapt_key.asc
sudo add-apt-repository "deb [arch=amd64] https://r2u.stat.illinois.edu/ubuntu jammy main"
sudo apt update

sudo apt-get install -y r-cran-ggplot2
Note that all dependencies (let it be an R package or system/Ubuntu package) have been automatically resolved and installed.
Don't forget to click on the brush icon to clean up your terminal output if needed.
Optionally enable
bspmto enable binary package installations via the traditionalinstall.packagesR function. -
Ready to use it from R after restarting the session:
library(ggplot2)
ggplot(mtcars, aes(hp)) + geom_histogram()
-
Get some real-time data and visualize it:
-
Install the
devtoolsR package and a few others (binary distribution) in the RStudio/Terminal:sudo apt-get install -y r-cran-devtools r-cran-data.table r-cran-httr r-cran-jsonlite r-cran-data.table r-cran-stringi r-cran-stringr r-cran-glue r-cran-logger r-cran-snakecase
-
Switch back to the R console and install the
binancerR package from GitHub to interact with crypto exchanges (note the extra dependency to be installed from CRAN, no need to update any already installed package):devtools::install_github('daroczig/binancer', upgrade = FALSE)
-
First steps with live data: load the
binancerpackage and then use thebinance_klinesfunction to get the last 3 hours of Bitcoin price changes (in USD) with 1-minute granularity -- resulting in an object like:> str(klines) Classes ‘data.table’ and 'data.frame': 180 obs. of 12 variables: $ open_time : POSIXct, format: "2020-03-08 20:09:00" "2020-03-08 20:10:00" "2020-03-08 20:11:00" "2020-03-08 20:12:00" ... $ open : num 8292 8298 8298 8299 8298 ... $ high : num 8299 8299 8299 8299 8299 ... $ low : num 8292 8297 8297 8298 8296 ... $ close : num 8298 8298 8299 8298 8299 ... $ volume : num 25.65 9.57 20.21 9.65 24.69 ... $ close_time : POSIXct, format: "2020-03-08 20:09:59" "2020-03-08 20:10:59" "2020-03-08 20:11:59" "2020-03-08 20:12:59" ... $ quote_asset_volume : num 212759 79431 167677 80099 204883 ... $ trades : int 371 202 274 186 352 271 374 202 143 306 ... $ taker_buy_base_asset_volume : num 13.43 5.84 11.74 7.12 15.24 ... $ taker_buy_quote_asset_volume: num 111430 48448 97416 59071 126493 ... $ symbol : chr "BTCUSDT" "BTCUSDT" "BTCUSDT" "BTCUSDT" ... - attr(*, ".internal.selfref")=<externalptr>
Click here for the code generating the above ...
library(binancer)
klines <- binance_klines('BTCUSDT', interval = '1m', limit = 60*3)
str(klines)
summary(klines$close)
-
Visualize the data, eg on a simple line chart:
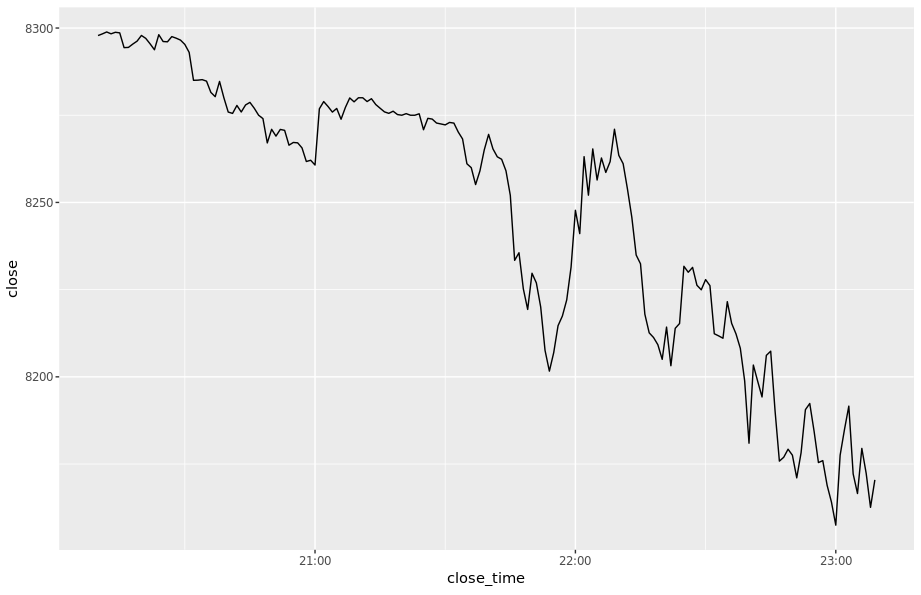
Click here for the code generating the above ...
library(ggplot2)
ggplot(klines, aes(close_time, close)) + geom_line()
-
Now create a candle chart, something like:
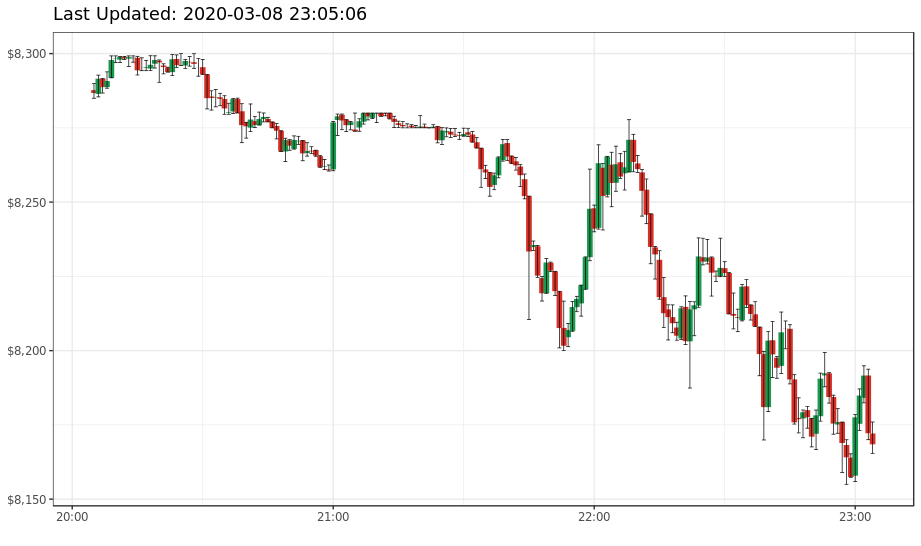
Click here for the code generating the above ...
library(scales)
ggplot(klines, aes(open_time)) +
    geom_linerange(aes(ymin = open, ymax = close, color = close < open), size = 2) +
    geom_errorbar(aes(ymin = low, ymax = high), size = 0.25) +
    theme_bw() + theme('legend.position' = 'none') + xlab('') +
    ggtitle(paste('Last Updated:', Sys.time())) +
    scale_y_continuous(labels = dollar) +
    scale_color_manual(values = c('#1a9850', '#d73027')) # RdYlGn
-
Compare prices of 4 currencies (eg BTC, ETH, BNB and XRP) in the past 24 hours on 15 mins intervals:
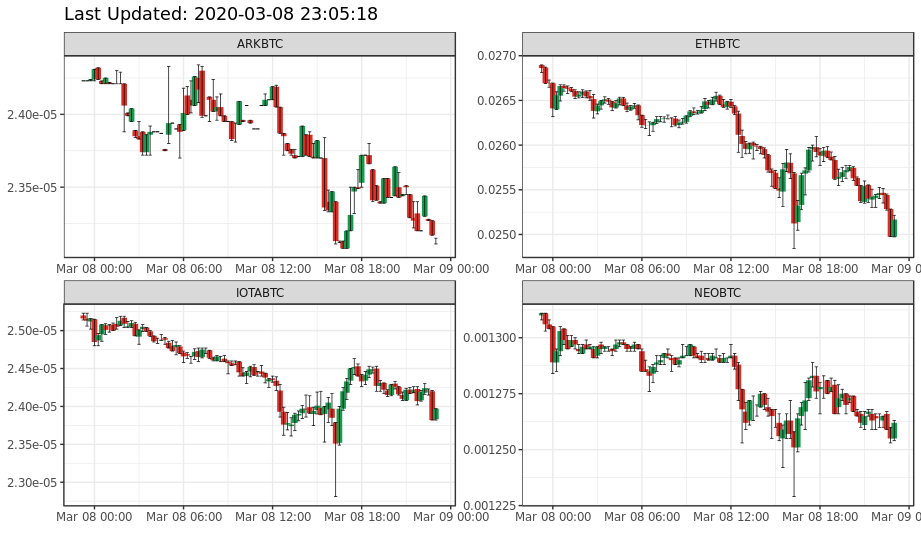
Click here for the code generating the above ...
library(data.table)
klines <- rbindlist(lapply(
    c('BTCUSDT', 'ETHUSDT', 'BNBUSDT', 'XRPUSDT'),
    binance_klines,
    interval = '15m', limit = 4*24))
ggplot(klines, aes(open_time)) +
    geom_linerange(aes(ymin = open, ymax = close, color = close < open), size = 2) +
    geom_errorbar(aes(ymin = low, ymax = high), size = 0.25) +
    theme_bw() + theme('legend.position' = 'none') + xlab('') +
    ggtitle(paste('Last Updated:', Sys.time())) +
    scale_color_manual(values = c('#1a9850', '#d73027')) +
    facet_wrap(~symbol, scales = 'free', nrow = 2)
-
Some further useful functions:
binance_ticker_all_prices()binance_coins_prices()binance_credentialsandbinance_balances
-
Create an R script that reports and/or plots on some cryptocurrencies, ideas:
- compute the (relative) change in prices of cryptocurrencies in the past 24 / 168 hours
- go back in time 1 / 12 / 24 months and "invest" $1K in BTC and see the value today
- write a bot buying and selling crypto on a virtual exchange
-

-
Install Jenkins from the RStudio/Terminal: https://www.jenkins.io/doc/book/installing/linux/#debianubuntu
sudo apt install -y fontconfig openjdk-17-jre

sudo wget -O /usr/share/keyrings/jenkins-keyring.asc \
  https://pkg.jenkins.io/debian-stable/jenkins.io-2023.key
echo deb [signed-by=/usr/share/keyrings/jenkins-keyring.asc] \
  https://pkg.jenkins.io/debian-stable binary/ | sudo tee \
  /etc/apt/sources.list.d/jenkins.list > /dev/null
sudo apt-get update
sudo apt-get install -y jenkins

sudo netstat -tapen | grep java
-
Open up port 8080 in the related security group
-
Access Jenkins from your browser and finish installation
-
Read the initial admin password from RStudio/Terminal via
sudo cat /var/lib/jenkins/secrets/initialAdminPassword
-
Proceed with installing the suggested plugins
-
Create your first user (eg
ceu)
-
Note that if loading Jenkins after getting a new IP takes a lot of time, it might be due to
not be able to load the theme.css as trying to search for that on the previous IP (as per
Jenkins URL setting). To overcome this, wait 2 mins for the theme.css timeout, login, disable
the dark theme: jenkinsci/dark-theme-plugin#458
Let's schedule a Jenkins job to check on the Bitcoin prices every hour!
-
Log in to Jenkins using your instance's public IP address and port 8080
-
Use the
ceuusername and set a password (note this user is a virtual one, not the same as the user in shell) -
Create a "New Item" (job):
-
Enter the name of the job:
get current Bitcoin price -
Pick "Freestyle project"
-
Click "OK"
-
Add a new "Execute shell" build step
-
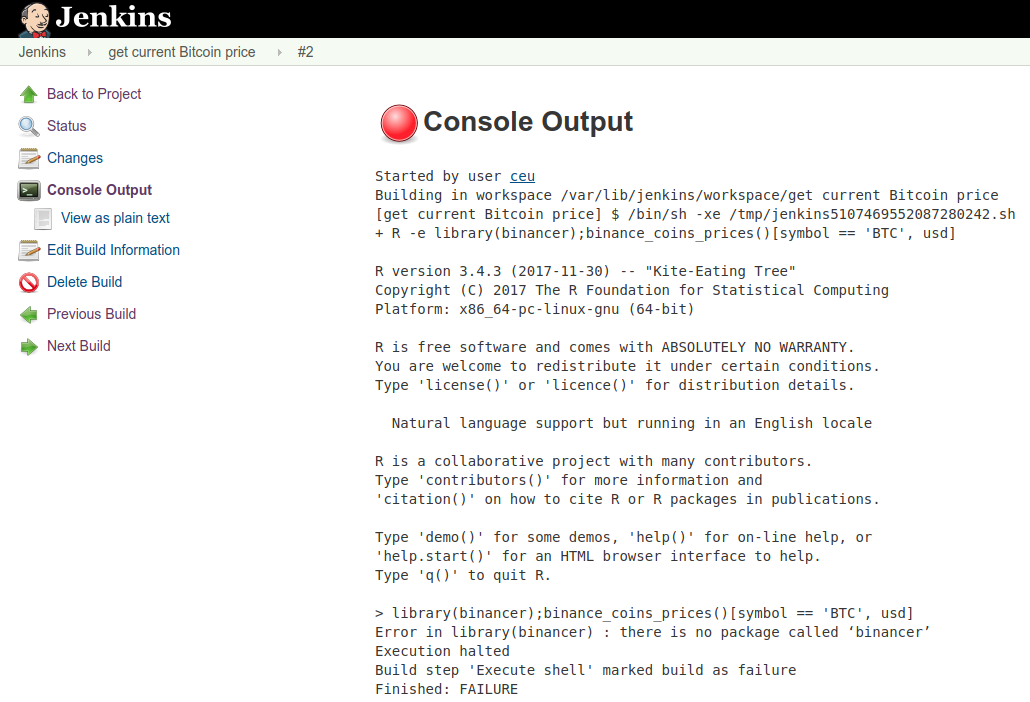
Enter the below command to look up the most recent BTC price
R -e "library(binancer);binance_coins_prices()[symbol == 'BTC', usd]" -
Run the job
-
-
Debug & figure out what's the problem ...
-
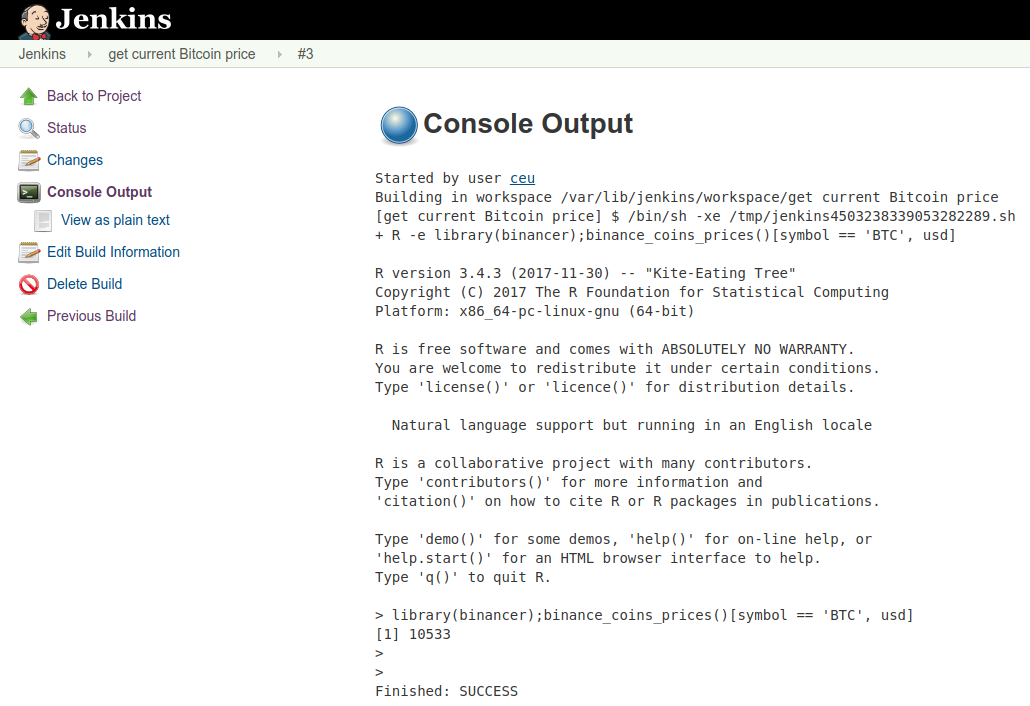
Install R packages system wide from RStudio/Terminal (more on this later):
Either start R in the terminal as the root user (via
sudo R) and run the previousdevtools::install_githubcommand there, or with a one-liner:sudo Rscript -e "library(devtools);withr::with_libpaths(new = '/usr/local/lib/R/site-library', install_github('daroczig/binancer', upgrade = FALSE))" -
Rerun the job
-
Optionally set up E-mail and Slack notification for the job success/error:
- Scroll down in the job config to the "Post-build Actions" section
- Add "Editable email notification", then fill in the "Project Recipient List" with an email address, and click "Advanced Settings" to define the triggers (e.g. send email on success or failure, and if you want to attach anything to the email).
- Add "Slack notifications" and configure the triggers, all the other details (e.g. which Slack channel to report to and Slack username etc have been configured globally, so although you can override, but no need to).
-
Create an R script with the below content and save on the server, eg as
/home/ceu/bitcoin-price.R:library(binancer) prices <- binance_coins_prices() paste('The current Bitcoin price is', prices[symbol == 'BTC', usd])
-
Follow the steps from the Schedule R commands section to create a new Jenkins job, but instead of calling
R -e "..."in shell step, reference the above R script usingRscriptinstead:Rscript /home/ceu/de3.R
Alternatively, you could also install little R for this purpose:
sudo apt install -y r-cran-littler
r /home/ceu/de3.R
Note the permission error, so let's add the
jenkinsuser to theceugroup:sudo adduser jenkins ceu
Then restart Jenkins from the RStudio Server terminal:
sudo systemctl restart jenkins
A better solution will be later to commit our R script into a git repo, and make it part of the job to update from the repo.
-
Create an R script that generates a candlestick chart on the BTC prices from the past hour, saves as
btc.pngin the workspace, and update every 5 minutes!Example solution for the above ...
library(binancer)
library(ggplot2)
library(scales)
klines <- binance_klines('BTCUSDT', interval = '1m', limit = 60)
g <- ggplot(klines, aes(open_time)) +
        geom_linerange(aes(ymin = open, ymax = close, color = close < open), size = 2) +
        geom_errorbar(aes(ymin = low, ymax = high), size = 0.25) +
        theme_bw() + theme('legend.position' = 'none') + xlab('') +
        ggtitle(paste('Last Updated:', Sys.time())) +
        scale_y_continuous(labels = dollar) +
        scale_color_manual(values = c('#1a9850', '#d73027'))
ggsave('btc.png', plot = g, width = 10, height = 5)
-
Enter the name of the job:
Update BTC candlestick chart -
Pick "Freestyle project"
-
Click "OK"
-
Add a new "Execute shell" build step
-
Enter the below command to look up the most recent BTC price
Rscript /home/ceu/plot.R
-
Run the job
-
Look at the workspace that can be accessed from the sidebar menu of the job.
-
Quiz: https://forms.gle/ETsssYaXgHgRgHneA (10 mins)
What we convered last week:
- 2FA/MFA in AWS
- Creating EC2 nodes
- Connecting to EC2 nodes via SSH/Putty (note the difference between the PPK and PEM key formats)
- Updating security groups
- Installing RStudio Server
- The difference between R console and Shell
- The use of
sudoand how to grantroot(system administrator) privileges - Adding new Linux users, setting password, adding to group
- Installing R packages system-wide VS in the user's home folder
- Installing, setting up and first steps with Jenkins
Note that you do NOT need to do the instructions below marked with the 💪 emoji -- those have been already done for you, and the related steps are only included below for documenting what has been done and demonstrated in the class.
💪 Instead of starting from scratch, let's create an Amazon Machine Image (AMI) from the EC2 node we used last week, so that we can use that as the basis of all the next steps:
- Find the EC2 node in the EC2 console
- Right click, then "Image and tempaltes" / "Create image"
- Name the AMI and click "Create image"
- It might take a few minutes to finish
Then you can use the newly created de3 AMI to spin up a new instance for you:
- Go the the Instances overview at https://eu-west-1.console.aws.amazon.com/ec2/v2/home?region=eu-west-1#Instances:sort=instanceId
- Click "Launch Instance"
- Provide a name for your server (e.g.
daroczig-de3-week2) and some additional tags for resource tracking, including tagging downstream services, such as Instance and Volumes:- Class:
DE3 - Owner:
daroczig
- Class:
- Pick the
de3AMI - Pick
t3a.medium(4 GiB of RAM should be enough for most tasks) instance type (see more instance types) - Select your AWS key created above and launch
- Select the
de3security group - click "Advanced details" and select
ceudataserverIAM instance profile - Click "Launch instance"
- Note and click on the instance id
We'll export the list of IAM users from AWS and create a system user for everyone.
-
Attach a newly created IAM EC2 Role (let's call it
ceudataserver) to the EC2 box and assign 'Read-only IAM access' (IAMReadOnlyAccess):


-
Install AWS CLI tool:
sudo apt update sudo apt install awscli -
List all the IAM users: https://docs.aws.amazon.com/cli/latest/reference/iam/list-users.html
aws iam list-users -
Export the list of users from R:
library(jsonlite) users <- fromJSON(system('aws iam list-users', intern = TRUE)) str(users) users[[1]]$UserName -
Create a new system user on the box (for RStudio Server access) for every IAM user, set password and add to group:
library(logger)
library(glue)
for (user in users[[1]]$UserName) {

  ## remove invalid character
  user <- sub('@.*', '', user)
  user <- sub('.', '_', user, fixed = TRUE)

  log_info('Creating {user}')
  system(glue("sudo adduser --disabled-password --quiet --gecos '' {user}"))

  log_info('Setting password for {user}')
  system(glue("echo '{user}:secretpass' | sudo chpasswd")) # note the single quotes + placement of sudo

  log_info('Adding {user} to sudo group')
  system(glue('sudo adduser {user} sudo'))

}
Note, you may have to temporarily enable passwordless sudo for this user (if have not done already) :/
ceu ALL=(ALL) NOPASSWD:ALL
Check users:
readLines('/etc/passwd')
Update the security backend to use real Unix users for shared access (if users already created):
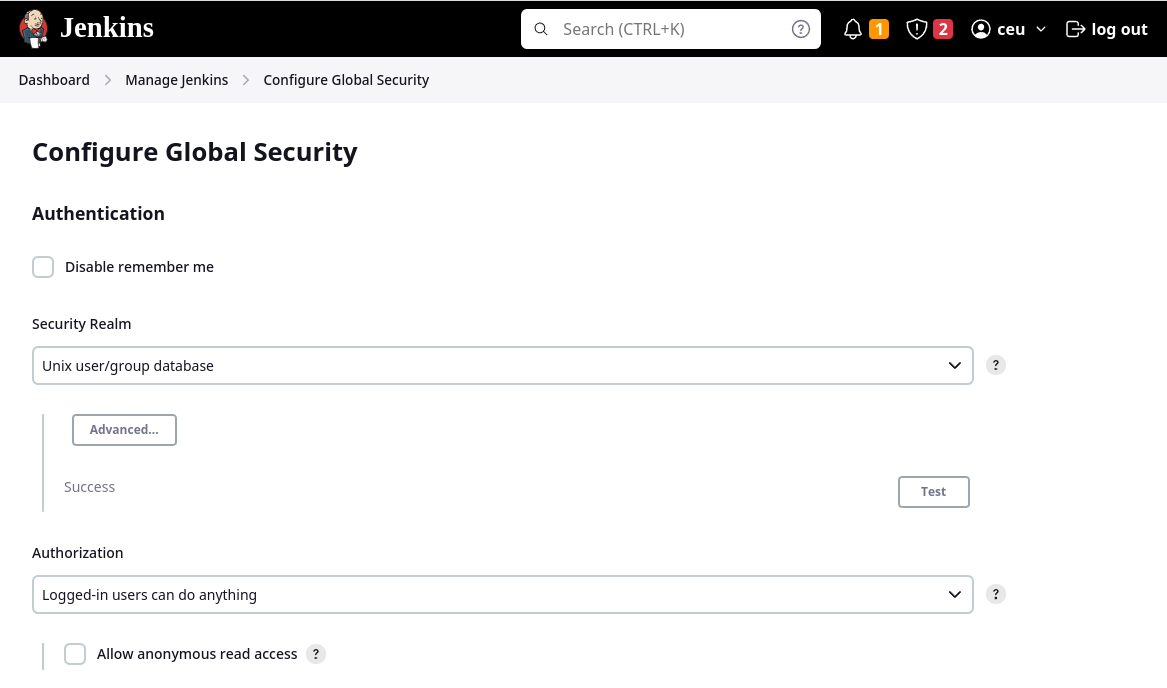
And allow jenkins to authenticate UNIX users and restart:
sudo adduser jenkins shadow
sudo systemctl restart jenkins
Then make sure to test new user access in an incognito window to avoid closing yourself out :)
Optionally you can associate a fixed IP address to your box:
- Allocate a new Elastic IP address at https://eu-west-1.console.aws.amazon.com/ec2/v2/home?region=eu-west-1#Addresses:
- Name this resource by assigning a "Name" tag
- Associate this Elastic IP with your stopped box, then start it
Optionally you can associate a subdomain with your node, using the above created Elastic IP address:
-
Go to Route 53: https://console.aws.amazon.com/route53/home
-
Go to Hosted Zones and click on
ceudata.net -
Create a new Record, where
- fill in the desired
Name(subdomain), egde3.ceudata.net - paste the public IP address or hostname of your server in the
Valuefield - click
Create
- fill in the desired
-
Now you will be able to access your box using this custon (sub)domain, no need to remember IP addresses.
To avoid using ports like 8787 and 8080 (and get blocked by the firewall installed on the CEU WiFi), let's configure our services to listen on the standard 80 (HTTP) and potentially on the 443 (HTTPS) port as well, and serve RStudio on the /rstudio, and Jenkins on the /jenkins path.
For this end, we will use Nginx as a reverse-proxy, so let's install it first:
sudo apt install -y nginxFirst, we need to edit the Nginx config to enable websockets for Shiny apps etc in /etc/nginx/nginx.conf under the http section:
  map $http_upgrade $connection_upgrade {
      default upgrade;
      ''      close;
    }
Then we need to edit the main site's configuration at /etc/nginx/sites-enabled/default to act as a proxy, which also do some transformations, eg rewriting the URL (removing the /rstudio path) before hitting RStudio Server:
server {
    listen 80;
    rewrite ^/rstudio$ $scheme://$http_host/rstudio/ permanent;
    location /rstudio/ {
      rewrite ^/rstudio/(.*)$ /$1 break;
      proxy_pass http://localhost:8787;
      proxy_redirect http://localhost:8787/ $scheme://$http_host/rstudio/;
      proxy_http_version 1.1;
      proxy_set_header Upgrade $http_upgrade;
      proxy_set_header Connection $connection_upgrade;
      proxy_read_timeout 20d;
    }
}
And restart Nginx:
sudo systemctl restart nginxFind more information at https://support.rstudio.com/hc/en-us/articles/200552326-Running-RStudio-Server-with-a-Proxy.
Let's see if the port is open on the machine:
sudo netstat -tapen|grep LISTLet's see if we can access RStudio Server on the new path:
curl localhost/rstudioNow let's see from the outside world ... and realize that we need to open up port 80!
Now we need to tweak the config to support Jenkins as well, but the above Nginx rewrite hack will not work (see https://www.jenkins.io/doc/book/system-administration/reverse-proxy-configuration-troubleshooting/ for more details), so we will just make it a standard reverse-proxy, eg:
server {
    listen 80;
    rewrite ^/rstudio$ $scheme://$http_host/rstudio/ permanent;
    location / {

    }
    location /rstudio/ {
      rewrite ^/rstudio/(.*)$ /$1 break;
      proxy_pass http://localhost:8787;
      proxy_redirect http://localhost:8787/ $scheme://$http_host/rstudio/;
      proxy_http_version 1.1;
      proxy_set_header Upgrade $http_upgrade;
      proxy_set_header Connection $connection_upgrade;
      proxy_read_timeout 20d;
    }
    location ^~ /jenkins/ {
      proxy_pass http://127.0.0.1:8080/jenkins/;
      proxy_set_header X-Real-IP  $remote_addr;
      proxy_set_header X-Forwarded-For $remote_addr;
      proxy_set_header Host $host;
    }
}
And we also need to let Jenkins also know about the custom path, so uncomment Environment="JENKINS_PREFIX=/jenkins" in /lib/systemd/system/jenkins.service, then reload the Systemd configs and restart Jenkins:
sudo systemctl daemon-reload
sudo systemctl restart jenkins
See more details at the Jenkins reverse proxy guide.
Optionally, replace the default, system-wide index.html for folks visiting the root domain without either the rstudio or jenkins path (note that instead of the editing the file, which might be overwritten with package updates, it would be better to create a new HTML file and refer that from the Nginx configuration, but we will keep it simple and dirty for now):
echo "Welcome to DE3! Are you looking for <code>/rstudio</code> or <code>/jenkins</code>?" | sudo tee /usr/share/nginx/html/index.htmlThen restart Jenkins, and good to go!
It might be useful to also proxy port 8000 for future use via updating the Nginx config to:
server {
    listen 80;
    rewrite ^/rstudio$ $scheme://$http_host/rstudio/ permanent;
    location / {

    }
    location /rstudio/ {
      rewrite ^/rstudio/(.*)$ /$1 break;
      proxy_pass http://localhost:8787;
      proxy_redirect http://localhost:8787/ $scheme://$http_host/rstudio/;
      proxy_http_version 1.1;
      proxy_set_header Upgrade $http_upgrade;
      proxy_set_header Connection $connection_upgrade;
      proxy_read_timeout 20d;
    }
    location ^~ /jenkins/ {
      proxy_pass http://127.0.0.1:8080/jenkins/;
      proxy_set_header X-Real-IP  $remote_addr;
      proxy_set_header X-Forwarded-For $remote_addr;
      proxy_set_header Host $host;
    }
    location ^~ /8000/ {
      rewrite ^/8000/(.*)$ /$1 break;
      proxy_pass http://127.0.0.1:8000;
      proxy_set_header X-Real-IP  $remote_addr;
      proxy_set_header X-Forwarded-For $remote_addr;
      proxy_set_header Host $host;
    }
}
This way you can access the above services via the below URLs:
RStudio Server:
Jenkins:
Port 8000:
If you cannot access RStudio Server on port 80, you might need to restart nginx as per above.
Next, set up SSL either with Nginx or placing an AWS Load Balancer in front of the EC2 node.
-
Note that a
crypto.Rfile has been placed in your home folder. We can make use of that in Jenkins to run every 5 minutes. Edit the "btc price" job in Jenkins, and fix the path of the file in the Build Steps, then enable the "Build periodically" trigger:H/5 * * * * -
Find the generated plot! It's in the Workspace (left sidebar of the project). Note that the aspect ratio is not great, fix in in the R script as per below:
ggsave('btc.png', plot = g, width = 10, height = 5)
-
Let find a better way to track changes in the file, e.g.
-
Use a git repository to store the R scripts and fetch the most recent version on job start:
-
Configure the Jenkins job to use "Git" in the "Source Code Management" section, and use e.g. https://gist.github.com/daroczig/e5d3ee3664549932bb7f23ce8e93e472 as the repo URL, and specify the branch (
main). -
Update the Execute task section to refer to the
btcprice.Rfile of the repo instead of the hardcoded local path.Rscript btcprice.R -
Make edits to the repo, e.g. update lookback to 3 hours and check a future job output.
-
-
💪 Configure notifications via eg https://app.mailjet.com/signin or https://resend.com
-
Sign up, confirm your e-mail address and domain
-
Take a note on the SMTP settings, eg
- SMTP server: in-v3.mailjet.com
- Port: 465
- SSL: Yes
- Username: ***
- Password: ***
or
- SMTP server: smtp.resend.com
- Port: 465
- SSL: Yes
- Username: resend
- Password: ***
-
Configure Jenkins at http://de3.ceudata.net/jenkins/configure
-
Set up the default FROM e-mail address at "System Admin e-mail address": jenkins@ceudata.net
-
Search for "Extended E-mail Notification" and configure
- SMTP Server
- Click "Advanced"
- Check "Use SMTP Authentication"
- Enter User Name from the above steps
- Enter Password from the above steps
- Check "Use SSL"
- SMTP port: 465
-
-
-
Set up "Post-build Actions" in Jenkins: Editable Email Notification - read the manual and info popups, configure to get an e-mail on job failures and fixes
-
Configure the job to send the whole e-mail body as the deault body template for all outgoing emails
${BUILD_LOG, maxLines=1000} -
Attach the plot to the email on Success.
-
Look at other Jenkins plugins, eg the Slack Notifier: https://plugins.jenkins.io/slack
We need a persistent storage for our Jenkins jobs ... let's give a try to a key-value database:
-
💪 Install server
sudo apt install redis-server
netstat -tapen | grep LIST
Test using the CLI tool:
redis-cli get foo redis-cli set foo 42 redis-cli get foo redis-cli del foo -
💪 Install an R client
Although we could use the
RcppRedisavailable on CRAN, so thus also in our already added apt repo, butrredisprovides some convenient helpers that we plan to use, so we are going to install that as well from a custom R package repository to also demonstrate howdratworks:sudo apt install -y r-cran-rcppredis sudo Rscript -e "withr::with_libpaths(new = '/usr/local/lib/R/site-library', install.packages('rredis', repos=c('https://ghrr.github.io/drat', 'https://cloud.r-project.org')))" -
Interact from R
## set up and initialize the connection to the local redis server
library(rredis)
redisConnect()

## set/get values
redisSet('foo', 'bar')
redisGet('foo')

## increment and decrease counters
redisIncr('counter')
redisIncr('counter')
redisIncr('counter')
redisGet('counter')
redisDecr('counter')
redisDecr('counter2')

## get multiple values at once
redisMGet(c('counter', 'counter2'))

## list all keys
redisKeys()

## drop all keys
redisDelete(redisKeys())
For more examples and ideas, see the rredis package vignette or try the interactive, genaral (not R-specific) redis tutorial.
-
Exercises
- Create a Jenkins job running every minute to cache the most recent Bitcoin and Ethereum prices in Redis
- Write an R script in RStudio that can read the Bitcoin and Ethereum prices from the Redis cache
- Make both scripts available in git (e.g. as a gist)
Example solution ...
library(binancer)
library(data.table)
prices <- binance_coins_prices()

library(rredis)
redisConnect()


redisSet('username:price:BTC', prices[symbol == 'BTC', usd])
redisSet('username:price:ETH', prices[symbol == 'ETH', usd])

redisGet('username:price:BTC')
redisGet('username:price:ETH')

redisMGet(c('username:price:BTC', 'username:price:ETH'))
Example solution using a helper function doing some logging ...
library(binancer)
library(logger)
library(rredis)
redisConnect()

store <- function(s) {
  ## TODO use the checkmate pkg to assert the type of symbol
  log_info('Looking up and storing {s}')
  value <- binance_coins_prices()[symbol == s, usd]
  key <- paste('username', 'price', s, sep = ':')
  redisSet(key, value)
  log_info('The price of {s} is {value}')
}

store('BTC')
store('ETH')

## list all keys with the "price" prefix and lookup the actual values
redisMGet(redisKeys('username:price:*'))
More on databases at the "Mastering R" class in the Spring semester ;)
- Join the #ba-de3-2023-bots channel in the
ceu-bizanalyticsSlack - 💪 A custom Slack app is already created at https://ceu-bizanalytics.slack.com/services/B0101G5EDS4, but feel free to create a new one and use the related app in the following steps
- Look up the app's bots in the sidebar
- Look up the API Token
-
Do not store the token in plain-text!
-
Let's use Amazon's Key Management Service: https://github.com/daroczig/CEU-R-prod/raw/2017-2018/AWR.Kinesis/AWR.Kinesis-talk.pdf (slides 73-75)
-
💪 Instead of using the Java SDK referenced in the above talk, let's install
boto3Python module and use viareticulate:sudo apt install -y python3-pip sudo pip3 install boto3 sudo apt install -y r-cran-reticulate r-cran-botor
-
💪 Create a key in the Key Management Service (KMS):
alias/de3 -
💪 Grant access to that KMS key by creating an EC2 IAM role at https://console.aws.amazon.com/iam/home?region=eu-west-1#/roles with the
AWSKeyManagementServicePowerUserpolicy and explicit grant access to the key in the KMS console -
Attach the newly created IAM role
-
Use this KMS key to encrypt the Slack token:
library(botor)
botor(region = 'eu-west-1')
kms_encrypt('token', key = 'alias/de3')
Note, if R asks you to install Miniconda, say NO, as Python3 and the required packages have already been installed system-wide.
-
Store the ciphertext and use
kms_decryptto decrypt later, see egkms_decrypt("AQICAHgzIk6iRoD8yYhFk//xayHj0G7uYfdCxrW6ncfAZob2MwHNrEj6Uxlfg1MmD+ImwvYTAAAAmjCBlwYJKoZIhvcNAQcGoIGJMIGGAgEAMIGABgkqhkiG9w0BBwEwHgYJYIZIAWUDBAEuMBEEDNM5AhEiMBUacg2f2AIBEIBTgvo4Z9+/ayuYnKNFQpICgV9H06u7plFFT/cSk4KUslnj2i8Xn9bgmQWSep0USG3NK1jR+DweQpxvh18/OO+pSiIII+O1yiv5Ql5R4EozjhmGGBY=") -
💪 Alternatively, use the AWS Parameter Store or Secrets Manager, see eg https://eu-west-1.console.aws.amazon.com/systems-manager/parameters/?region=eu-west-1&tab=Table and granting the
AmazonSSMReadOnlyAccesspolicy to your IAM role or user.ssm_get_parameter('slack')
-
💪 Install the Slack R client
sudo apt install -y r-cran-slackr
-
Init and send our first messages with
slackrlibrary(botor) botor(region = 'eu-west-1') token <- ssm_get_parameter('slack') library(slackr) slackr_setup(username = 'jenkins', token = token, icon_emoji = ':jenkins-rage:') slackr_msg(text = 'Hi there!', channel = '#ba-de3-2022-bots')
-
A more complex message
library(binancer)
prices <- binance_coins_prices()
msg <- sprintf(':money_with_wings: The current Bitcoin price is: $%s', prices[symbol == 'BTC', usd])
slackr_msg(text = msg, preformatted = FALSE, channel = '#ba-de3-2022-bots')
-
Or plot
library(ggplot2)
klines <- binance_klines('BTCUSDT', interval = '1m', limit = 60*3)
p <- ggplot(klines, aes(close_time, close)) + geom_line()
ggslackr(plot = p, channels = '#ba-de3-2022-bots', width = 12)
- Create a Jenkins job to alert if Bitcoin price is below $60K or higher than $65K.
- Create a Jenkins job to alert if Bitcoin price changed more than $200 in the past hour.
- Create a Jenkins job to alert if Bitcoin price changed more than 5% in the past day.
- Create a Jenkins job running hourly to generate a candlestick chart on the price of BTC and ETH.
Example solution for the first exercise ...
## get data right from the Binance API
library(binancer)
btc <- binance_klines('BTCUSDT', interval = '1m', limit = 1)$close

## or from the local cache (updated every minute from Jenkins as per above)
library(rredis)
redisConnect()
btc <- redisGet('username:price:BTC')

## log whatever was retreived
library(logger)
log_info('The current price of a Bitcoin is ${btc}')

## send alert
if (btc < 60000 | btc > 65000) {
  library(botor)
  botor(region = 'eu-west-1')
  token <- ssm_get_parameter('slack')
  library(slackr)
  slackr_setup(username = 'jenkins', token = token, icon_emoji = ':jenkins-rage:')
  slackr_msg(
    text = paste('uh ... oh... BTC price:', btc),
    channel = '#ba-de3-2023-bots')
}-
💪 Install plumber: rplumber.io
sudo apt install -y r-cran-plumber
-
Create an API endpoint to show the min, max and mean price of a BTC in the past hour!
Create
~/plumber.Rwith the below content:library(binancer) #* BTC stats #* @get /btc function() { klines <- binance_klines('BTCUSDT', interval = '1m', limit = 60L) klines[, .(min = min(close), mean = mean(close), max = max(close))] }
Start the plumber application wither via clicking on the "Run API" button or the below commands:
library(plumber)
pr("plumber.R") %>% pr_run(host='0.0.0.0', port=8000)
-
Add a new API endpoint to generate the candlestick chart with dynamic symbol (default to BTC), interval and limit! Note that you might need a new
@serializer, function arguments, and type conversions as well.Example solution for the above ...
library(binancer)
library(ggplot2)
library(scales)

#* Generate plot
#* @param symbol coin pair
#* @param interval:str enum
#* @param limit integer
#* @get /klines
#* @serializer png
function(symbol = 'BTCUSDT', interval = '1m', limit = 60L) {
  klines <- binance_klines(symbol, interval = interval, limit = as.integer(limit)) # NOTE int conversion
  library(scales)
  p <- ggplot(klines, aes(open_time)) +
    geom_linerange(aes(ymin = open, ymax = close, color = close < open), size = 2) +
    geom_errorbar(aes(ymin = low, ymax = high), size = 0.25) +
    theme_bw() + theme('legend.position' = 'none') + xlab('') +
    ggtitle(paste('Last Updated:', Sys.time())) +
    scale_y_continuous(labels = dollar) +
    scale_color_manual(values = c('#1a9850', '#d73027')) # RdYlGn
  print(p)
}
-
Add a new API endpoint to generate a HTML report including both the above!
Example solution for the above ...
💪 Update the
markdownpackage:sudo apt install -y r-cran-markdown
Create an R markdown for the reporting:
---
title: "report"
output: html_document
date: "`r Sys.Date()`"
---

```{r setup, include=FALSE}
knitr::opts_chunk$set(echo = FALSE, warning=FALSE)
library(binancer)
library(ggplot2)
library(scales)
library(knitr)

klines <- function() {
  binance_klines('BTCUSDT', interval = '1m', limit = 60L)
}
```

Bitcoin stats:

```{r stats}
kable(klines()[, .(min = min(close), mean = mean(close), max = max(close))])
```

On a nice plot:

```{r plot}
ggplot(klines(), aes(open_time, )) +
  geom_linerange(aes(ymin = open, ymax = close, color = close < open), size = 2) +
  geom_errorbar(aes(ymin = low, ymax = high), size = 0.25) +
  theme_bw() + theme('legend.position' = 'none') + xlab('') +
  ggtitle(paste('Last Updated:', Sys.time())) +
  scale_y_continuous(labels = dollar) +
  scale_color_manual(values = c('#1a9850', '#d73027'))
```
And the plumber file:
library(binancer)
library(ggplot2)
library(scales)
library(rmarkdown)
library(plumber)

#' Gets BTC data from the past hour
#' @return data.table
klines <- function() {
    binance_klines('BTCUSDT', interval = '1m', limit = 60L)
}

#* BTC stats
#* @get /stats
function() {
  klines()[, .(min = min(close), mean = mean(close), max = max(close))]
}

#* Generate plot
#* @get /plot
#* @serializer png
function() {
  p <- ggplot(klines(), aes(open_time, )) +
    geom_linerange(aes(ymin = open, ymax = close, color = close < open), size = 2) +
    geom_errorbar(aes(ymin = low, ymax = high), size = 0.25) +
    theme_bw() + theme('legend.position' = 'none') + xlab('') +
    ggtitle(paste('Last Updated:', Sys.time())) +
    scale_y_continuous(labels = dollar) +
    scale_color_manual(values = c('#1a9850', '#d73027')) # RdYlGn
  print(p)
}

#* Generate HTML
#* @get /report
#* @serializer html
function(res) {
   filename <- tempfile(fileext = '.html')
   on.exit(unlink(filename))
   render('report.Rmd', output_file = filename)
   include_file(filename, res)
}
Run via:
library(plumber)
pr('plumber.R') %>% pr_run(port = 8000)
Try to DRY (don't repeat yourself!) this up as much as possible. Attend the "Mastering R" class to learn more :)
Bundle all the scripts into a single Docker image:
- 💪 Install Docker:
curl -fsSL https://download.docker.com/linux/ubuntu/gpg | sudo gpg --dearmor -o /etc/apt/keyrings/docker.gpg
echo \
  "deb [arch=$(dpkg --print-architecture) signed-by=/etc/apt/keyrings/docker.gpg] \
  https://download.docker.com/linux/ubuntu \
  $(lsb_release -cs) stable" | sudo tee /etc/apt/sources.list.d/docker.list > /dev/null
sudo apt-get update
sudo apt-get install -y docker-ce- Create a new file named
Dockerfile(File/New file/Text file to avoid auto-adding theRfile extension) with the below content to add the required files and set the default working directory to the same folder:
FROM rstudio/plumber

RUN apt-get update && apt-get install -y pandoc && apt-get clean && rm -rf /var/lib/apt/lists/
RUN install2.r ggplot2
RUN installGithub.r daroczig/binancer
ADD report.Rmd /app/report.Rmd
ADD plumber.R /app/plumber.R
EXPOSE 8000
WORKDIR /app
Note the the step installing the required R paackages!
- Build the Docker image:
sudo docker build -t btc-report-api .- Run a container based on the above image:
sudo docker run -p 8000:8000 -ti btc-report-api plumber.R- Test by visiting the
8000port or the Nginx proxy at http://de3.ceudata.net/8000, e.g. Swagger docs at http://de3.ceudata.net/8000/__docs__/#/default/get_report or an endpoint directly at http://de3.ceudata.net/8000/report.
Now let's make the above created and tested Docker image available outside of the RStudio Server by uploading the Docker image to Elastic Container Registry (ECR):
-
💪 Create a new private repository at https://eu-west-1.console.aws.amazon.com/ecr/home?region=eu-west-1, call it
de3-example-api -
💪 Assign the
EC2InstanceProfileForImageBuilderECRContainerBuildspolicy to theceudataserverIAM role so that we get RW access to the ECR repositories. Tighten this role up in prod! -
💪 Let's login to ECR on the RStudio Server so that we can upload the Docker image:
aws ecr get-login-password --region eu-west-1 | sudo docker login --username AWS --password-stdin 657609838022.dkr.ecr.eu-west-1.amazonaws.com -
💪 Tag the already build Docker image for upload:
sudo docker tag btc-report-api:latest 657609838022.dkr.ecr.eu-west-1.amazonaws.com/de3-example-api:latest
-
💪 Push the Docker image:
sudo docker push 657609838022.dkr.ecr.eu-west-1.amazonaws.com/de3-example-api:latest
-
Check the Docker repository at https://eu-west-1.console.aws.amazon.com/ecr/repositories/private/657609838022/de3-example-api?region=eu-west-1
-
Go to the Elastic Container Service (ECS) dashboard at https://eu-west-1.console.aws.amazon.com/ecs/home?region=eu-west-1#/
-
Create a task definition for the Docker run:
- Task name:
btc-api - Container name:
api - Image URI:
657609838022.dkr.ecr.eu-west-1.amazonaws.com/de3-example-api - Container port: 8000
- Command in the Docker configuration:
plumber.R - Review Task size, but default values should fine for this simple task
- Task name:
-
Create a new cluster, call it
BTC_API, using Fargate. Don't forget to add theClasstag! -
Create a Service in the newly created Cluster at https://eu-west-1.console.aws.amazon.com/ecs/v2/clusters/btc-api/services?region=eu-west-1
- Compute option can be "Launch type" for now
- Specify the Task Family as
btc-api - Provide the same as service name
- Use the
de3security group - Create a load balancer listening on port 80 (would need to create an SSL cert for HTTPS), and specify
/statsas the healthcheck path, with a 10 seconds grace period - Test the deployed service behind the load balancer, e.g. https://btc-api-1417435399.eu-west-1.elb.amazonaws.com/report
Read the rOpenSci Docker tutorial -- quiz next week! Think about why we might want to use Docker.
The goal of this assignment is to confirm that you have a general understanding on how to build data pipelines using Amazon Web Services and R, and can actually implement a stream processing application (either running in almost real-time or batched/scheduled way) or R-based API in practice.
To minimize the system administration and some of the already-covered engineering tasks for the students, the below pre-configured tools are provided as free options, but students can decide to build their own environment (on the top of or independently from these) and feel free to use any other tools:
de3Amazon Machine Image that you can use to spin up an EC2 node with RStudio Server, Shiny Server, Jenkins, Redis and Docker installed & pre-configured (use your AWS username and the password shared on Slack previously) along with the most often used R packages (including the ones we used for stream processing, egbotor,AWR.Kinesisand thebinancerpackage)de3EC2 IAM role with full access to Kinesis, Dynamodb, Cloudwatch and theslacktoken in the Parameter Storede3security group with open ports for RStudio Server and Jenkins- lecture and seminar notes at https://github.com/daroczig/CEU-R-prod
Make sure to clean-up your EC2 nodes, security groups, keys etc created in the past weeks, as left-over AWS resources will contribute negative points to your final grade! E.g. the EC2 node you created on the first week should be terminated.
-
Minimal project (for grade up to "B"): schedule a Jenkins job that runs every hour getting the past hour's 1-minute interval klines data on ETH prices (in USD). The job should be configured to pull the R script at the start of the job either from a private or public git repo or gist. Then
- Find the min and max price of ETH in the past hour, and post these stats in the
#bots-final-projectSlack channel. Make sure to set your username for the message, and use a custom emoji as the icon. - Find an R package that provides a function to draw candlestick charts (e.g.
tidyquant::geom_candlestick), and use that to post a candlestick chart on the past hour's ETH price in the#bots-final-projectSlack channel.
- Find the min and max price of ETH in the past hour, and post these stats in the
-
Recommended project (for grade up to "A"): Deploy an R-based API in ECS (like we did on the last week) for analyzing recent Binance (or any other real-time) data. The API should include at least 4 endpoints using different serializers, and these endpoints should be other than the ones we covered in the class. At least one endpoint should have at least a few parameters. Build a Docker image, push it to ECR, and deploy as service in ECS. Document the steps required to set up ECR/ECS with screenshots, then delete all services after confirming that everything works correctly.
Regarding feedback: by default, I add a super short feedback on Moodle as a comment to your submission (e.g. "good job" or "excellent" for grade A, or short details on why it was not A). If you want to received more feedback, please ping me on Slack to schedule a quick call. If you want early feedback (before grading), ping me on Slack at least a week before the submission deadline!
-
Create a PDF document that describes your solution and all the main steps involved with low level details: attach screenshots (including the URL nav bar and the date/time widget of your OS, so like full-screen and not area-picked screenshots) of your browser showing what you are doing in RStudio Server, Jenkins, or in the AWS dashboards, and make sure that the code you wrote is either visible on the screenshots, or included in the PDF.
-
STOP the EC2 Instance you worked on, but don’t terminate it, so I can start it and check how it works. Note that your instance will be terminated by me after the end of the class.
-
Include the
instance_idon the first page of the PDF, along with your name or student id. -
Upload the PDF to Moodle.
Midnight (CET) on April 21, 2024.
Contact Gergely Daroczi on the ceu-bizanalytics Slack channel or
open a GitHub ticket.