There are two leading theories as to why Graphite-News was created: people generally had nothing better to do than wonder which new types of information were being stored in their Graphite/Carbon databases. Or the second theory; I needed a little pet project to try out some programming in Go, etc. I will leave it up to you.
Graphite-News keeps tabs on which new data sources appear in your Graphite storage so that you can see what new functionality is being shipped inside your application. This is then exposed in a easy and simple web interface.
Couple of options, but the easiest (assuming you have Go setup) is just running the following (looking into providing debian packages and brew cookbooks):
$ go get github.com/ojilles/graphite-news
$ $GOPATH/bin/graphite-news -l $GOPATH/src/github.com/ojilles/graphite-news/creates.log
This should get graphite-news up and running, for you to be able to experiment with the UI and get a grasp of what it does. If you have recently created new data sources, you will see those. If not, create a new one for testing purposes with:
$ PORT=2003; SERVER=localhost; echo "local.random.diceroll 4 `date +%s`" | nc ${SERVER} ${PORT}
Now watch the graphite-news UI and see it showing up there.
Graphite-News has various configuration options which are worth exploring:
$ graphite-news -h
Usage: graphite-news [-i sec] [-p port] [-s graphite url] [-r] [-d] -l logfile Version: non-packaged (Compiled at now). Code over at: https://github.com/ojilles/graphite-news/
- d=false: If set, allow clients to delete recently created data sources
- i=5000: Number of [ms] interval for Web UI's to update themselves. Clients only update their config every 5min
- l=[]: One or more locations of the Carbon logfiles we need to tail. (F.ex. -l file1 -l file2 -l *.log)
- p=2934: Port number the webserver will bind to (pick a free one please)
- r=false: If set, report our own statistics every minute to a graphite host
- rh="localhost:2003": Change the graphite host for pushing metrics towards
- rp="graphite-news.metrics": Prepend all metric names with this string
- s="http://localhost:8080": URL of the Graphite render API, no trailing slash. Apple rendezvous domains do not work (like http://machine.local, use IPs in that case)
The most important ones are -l, through which you can tell graphite-news
where carbon is storing it's logfile (or files -- it'll happily monitor
multiple graphite instances). Depending on command line globbing, prefer to
list -l last. The second setting is -s which should point to the Graphite
Render API, so that we can show the metrics right in the graphite-news UI. For
example:
$ ~/graphite-news -s http://192.168.1.66:8080 -l /opt/graphite/log/launchctl-carbon*.stdout
Other settings include -d which will expose a Delete button in the UI. This
can be handy if you notice unwanted data sources in your news. This only works
if graphite-news is running on the same server as your Carbons and with similar
permissions. For example, you can now remove that local.random.diceroll you
created for experimentation. Please understand that the security risk of
enabling this is entirely yours.
Enabling -r, possibly with -rh and -rp allow you to export usage
statistics of graphite-news (how many data sources are added, how many users
are looking at the UI, etc) to be reported to Graphite. (See also further
down.)
If you are using Ansible, you can thank ianunruh for providing an Ansible role for Graphite News.
After starting graphite-news, it will tail through your logfile in search for
notifications that new data sources have been created and store those in
memory. If you point a browser to it (default port 2934, configurable through
-p) you are presented with this UI:
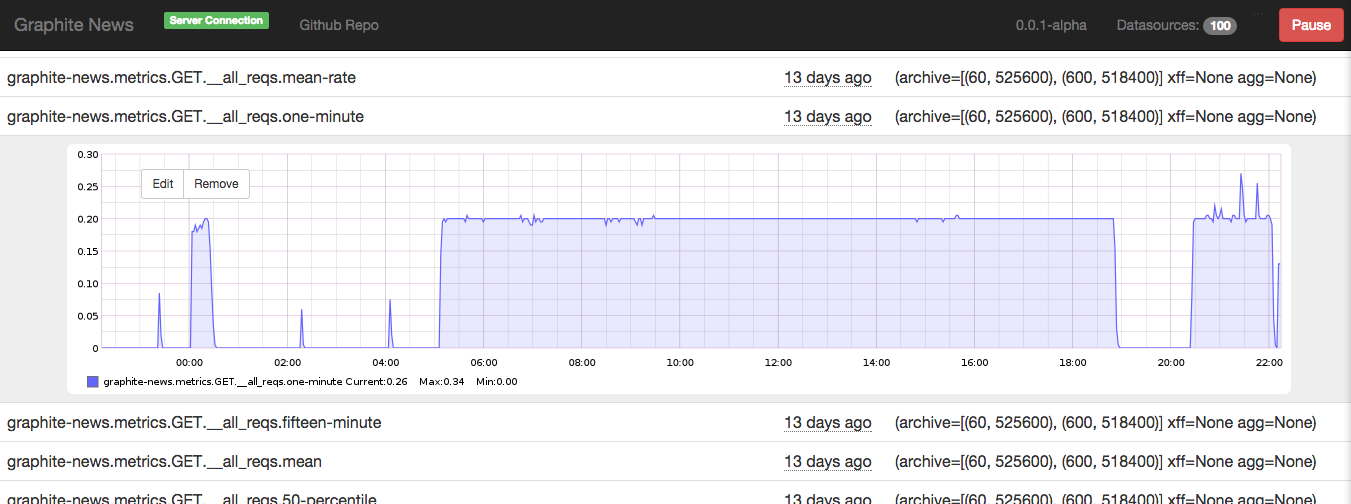
Walkthrough:
- Top left:
Server Connectionshows you if the client (this web app) is able to talk to the server side component. - Top right:
- Shows the number of data sources in the server, bit useless at the moment
- A button with which you can freeze your client with (e.g. no more data retrieval from the server)
- The rest of the UI is a long list of new data sources found with some
information on them. Interactions:
- Click on a line, will open that up and show you the graph for that metric
- Click on any other line, the previous one will close and the one belonging to the new line opens
- Click on that graph, and it gets closed
- Do nothing: the client will keep polling the server for more data sources and once found will automatically refresh and put that onto the page.
As you can see, very simple interaction model!
The go server process collects metrics about itself as well. These can be
reported back to graphite by using the -r flag, which is by default off. Once
enabled it will report all metrics to your Grahite server, by default located
at localhost:2003 but can be overridden by using the -rh flag. Metrics by
default will be reported under graphite-news.metrics at the top root, which
can be altered by using the -rp flag. Most likely, this will incite an
Inception-level experience to the operator once he views the Webinterface.
As an example, here is a screenshot from the json HTTP end-point (which is
used to ferry metrics from server to client-side browser):
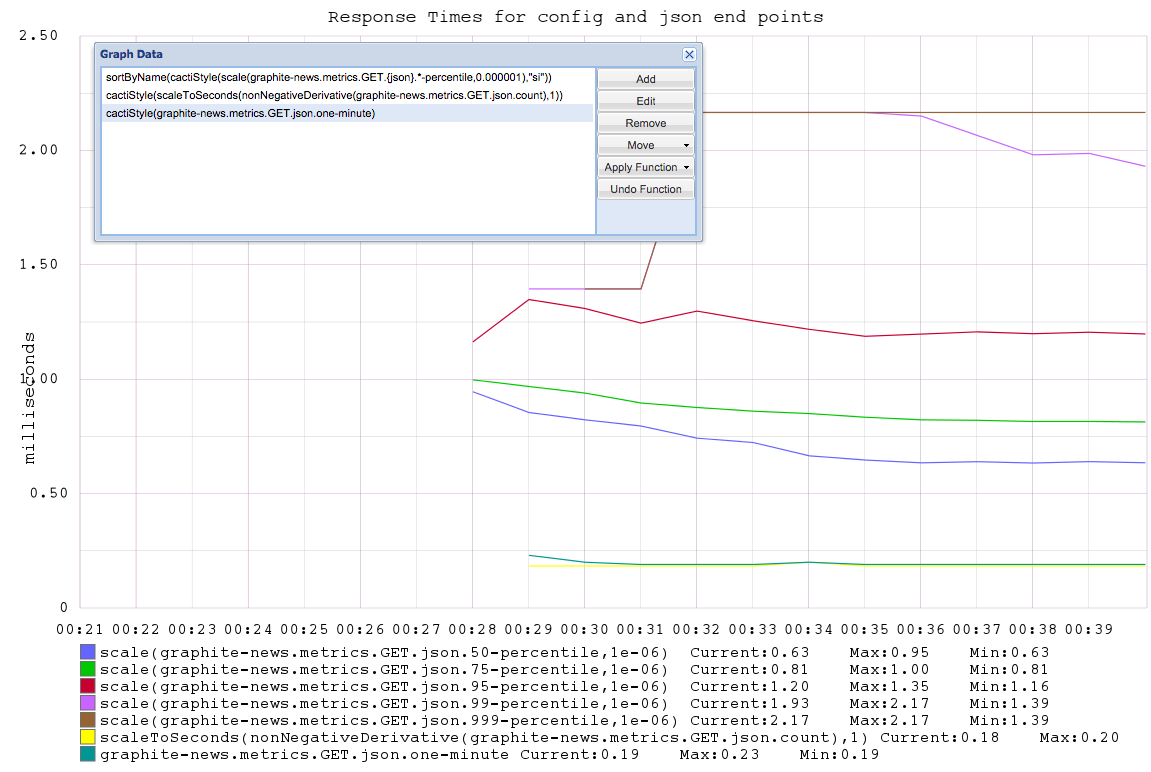
Couple of notes:
JSONend-point is requested by a client every 5 seconds. As you can see in the screenshot, theGET.json.one-minutemetric shows ~0.2 (as there was one client connected). Same with thecactiStyle(scaleToSeconds(nonNegativeDerivative(graphite-news.metrics.GET.json.count),1)).- All timing metrics are expressed as nanoseconds. To get back to the more
often used milliseconds in the web-domain, scale by 0.000001. For example:
sortByName(cactiStyle(scale(graphite-news.metrics.GET.{json}.*-percentile,0.000001),"si")) - All requests that are not 4xx/5xx responses are getting tracked by their
URL. General structure is to have the
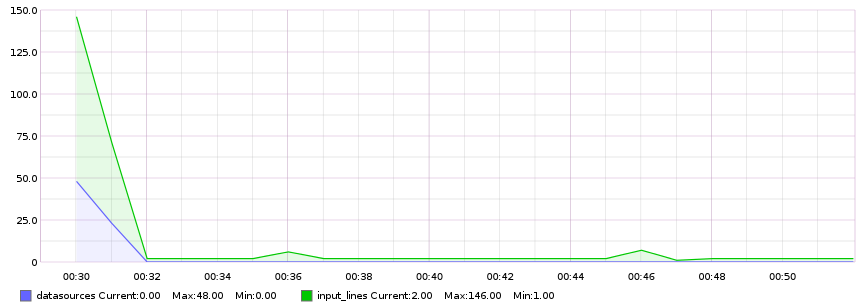
HTTP Method(e.g.GET), followed by the URL, followed by the various metrics. - All requests also get aggregated on the just the
HTTP Method, followed by__all_reqsfor easier top-level view. (F.ex.:GET.__all_reqs.count) tail.input_lines.countandtail.datasources.countwill let you know how many log-lines have been parsed and how many data sources have been found respectively. Here is an example graph to illustrate:
Build with (or exists despite the following things being used):
- Go (for tailing, server side state, webserver)
- go-bindata (to keep everything in 1 file for easy deployment)
- go-metrics (of course we keep tabs on our own metrics as well)
- Tested on Go 1.3 and tip
- Started to use goxc for cross platform compilation. (Work on a Mac but most graphite installs are on Ubuntu, bear with me, not my area of expertise. Tested once on Windows succesfully as well.)
- jQuery
- Bootstrap
- Travis.ci for running all the unit tests:

By default (go build or go install) the binary created does include all
static assets (such as javascript, css) needed for proper functioning, but
those are not pulled from the files on disk, but rather from bindata.go.
Regenerating bindata.go can be done with the provided build-dst.sh script.
This will result with all fresh assets in the binary (able to just scp to
another machine for example). Effectively, build-dst.sh only does:
go-bindata -ignore=\\.swp$ assets/...
Compiling across platforms is done via goxc, install via go get github.com/laher/goxc, then run goxc in the working directory.