This repository contains a dynamic visualization of the Collatz graph using Kotlin and Compose Multiplatform. The intention is to provide a small but not dead simple example of a complete Compose application.

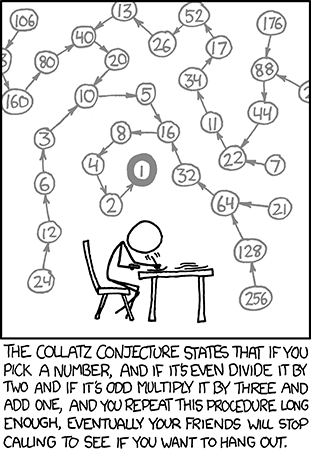
If you don't know what Collatz sequences are or what is meant by the Collatz graph, just stare at this xkcd for a moment:
Building such a graph for many numbers, displaying them using an angle path, and colorizing all lines with a scientific color gradient, you will get a visualization as shown in the first image.
Clone the repository and run
./gradlew runfrom a command line (on Windows it's gradlew.bat).
You can also open the the project in IntelliJ IDEA and it will import everything automatically. Afterwards, you can press the "play" button that should appear next to
fun main() = applicationin Main.kt.