
Work with NuPIC results interactively in a nice web UI. This app is designed to consume and render CSV files output by NuPIC, but it can read any CSV file with numerical data that has a timestamp as one of its fields.
- The first line in the CSV must be a header, containing the names of the fields.
- If there is, a field labeled
timestampis used for x-axis/time.
- The data in the
timestampfield can be either a number or a string in date-time format. To ensure that the app can parse the date, it is recommended that your timestamps conform to one of the following formats:
- ISO 8601:
yyyy-mm-dd[T[hh[:mm[:ss[:ms]]]]] yyyy-mm-dd [hh[:mm[:ss[:ms]]]](Like ISO 8601, but with a space separator for time instead of "T")mm/dd/yyyy [hh[:mm[:ss[:ms]]]]
- Any modern browser with JavaScript
- Your favorite web server for running locally
To try this app instantly, head to the online version at https://nupic-visualizations.firebaseapp.com/
You can use an OPF file as an example.
Or you can run locally, without a need for internet connection.
First, get a copy of this repo, you can download a ZIP from Github, or clone:
git clone https://github.com/nupic-community/nupic.visualizations
Then go the the build/ directory:
cd nupic.visualizations/build/
If you have Python installed, you can launch a simple Web server with:
python -m SimpleHTTPServer 8080
Open your web browser and go to http://localhost:8080
There are demo files in examples/ for NuPIC OPF, NAB and generic CSV files.
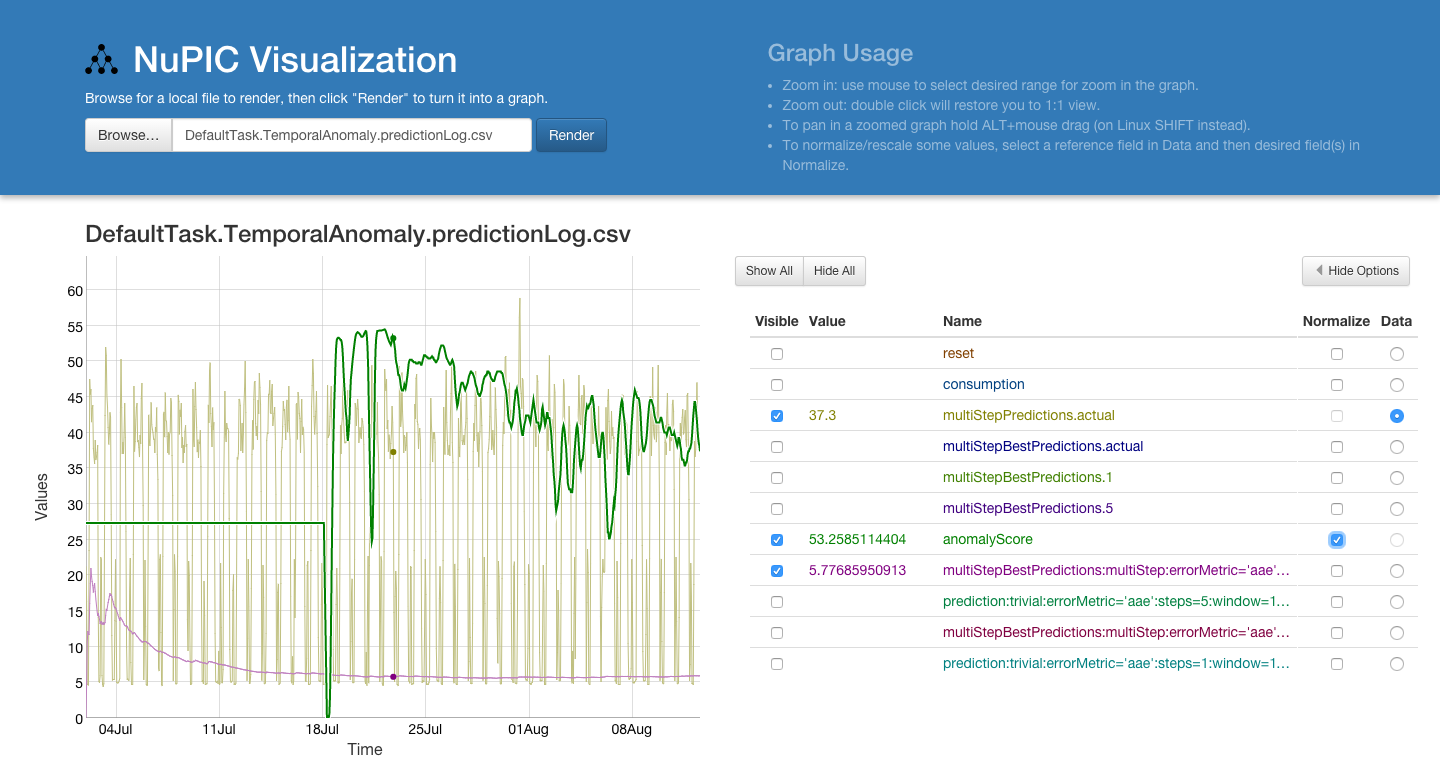
- Select a local file by clicking 'Browse...', this will start rendering a new graph.
- You may get warning/error labels, that can be closed.
- To zoom in on the graph, click and drag with the cursor. To zoom out, double-click. To pan on a zoomed graph, hold the ALT key (on Linux, hold the SHIFT key), while dragging the cursor.
- The options to the right of the graph allow the user to:
- Set the visibility of certain series
- View the current value of a series, based on where the cursor is over the graph
- Normalize any series to a selected reference series. For example, perhaps you want to compare your 'my_data' field to your 'anomaly_score' field, but your 'my_data' series varies between 100 and 10,000 - while your 'anomaly_score' field varies between 0 and 1. With the default settings, your anomaly score variations will be too small to be visible. By clicking on 'Data' for the 'my_data', and then checking the 'Normalize' checkbox for 'anomaly_score', the 'anomaly_score' will be scaled up to a ratio matching that of the 'my_data' field.
The goals of this project are:
- nice, convenient & easy to use interactive graph visualizations
- seamlessly runs everywhere (in web-browser, or cloud)
- plot as much as possible - generic CSV
- tries to parse timestamp/x-data from many formats
- no restrictions on the header format
- can plot even non-standart data - strings (planned)
- NuPIC specific OPF-file plotting
- extra work done to parse the OPF and extract the suitable fields
- graph interaction:
- show/hide, higlight a series, get current value under cursor
- range select to zoom in/out the graph, pan
- quickly export shown subsection of graph as a PNG image or CSV data (planned)
- manually annotate selected section with text data (planned)
- specific functionality for anomaly detection
- auto-highlight series over/under a threshold (or other condition)
- rescaling some series to be easily visible with the reference series
- with annotated anomalies, compute precision, recall, F-measure (planned)
- works with quite large data (million poitns)
- support for real-time streaming data sources (planned)
If you are interested in developing, or modifying the code, follow these instructions:
- Install
node(js) >= 0.10.25andnpm. This will vary depending on your OS.
On Ubuntu LTS you need to use newer packages, follow the nodejs guide.
- From the root directory of this project,
npm install. This will install all of the package dependencies. - Make your modifications.
- When you are ready to perform a build, run
gulp. This will build the app in thebuilddirectory. Launch the app as described in the "Launch" section, above.
The build/ directory contains all the static files needed to deploy this application. You can use any static file hosting service. For example, here are instructions for deploying to firebase. You can see this sample application deployed at https://nupic-visualizations.firebaseapp.com/ via Firebase.