A tool for producing flow metrics and forecasts for teams doing knowledge work.
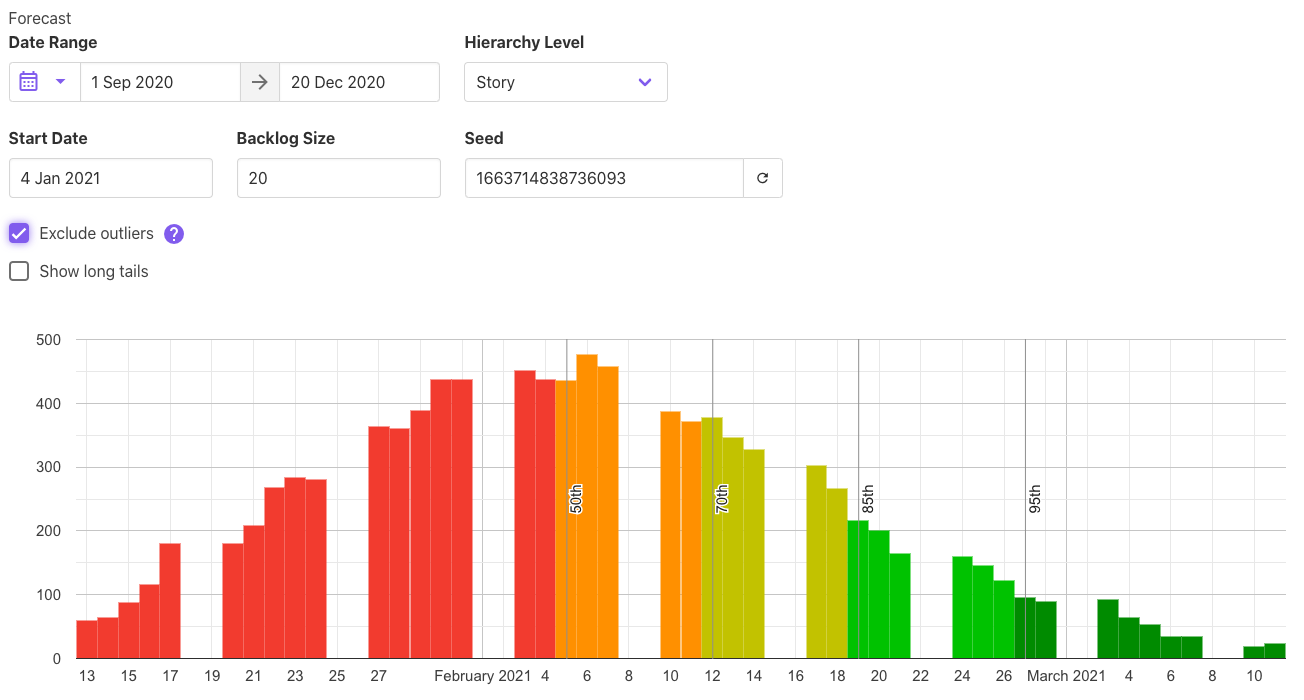
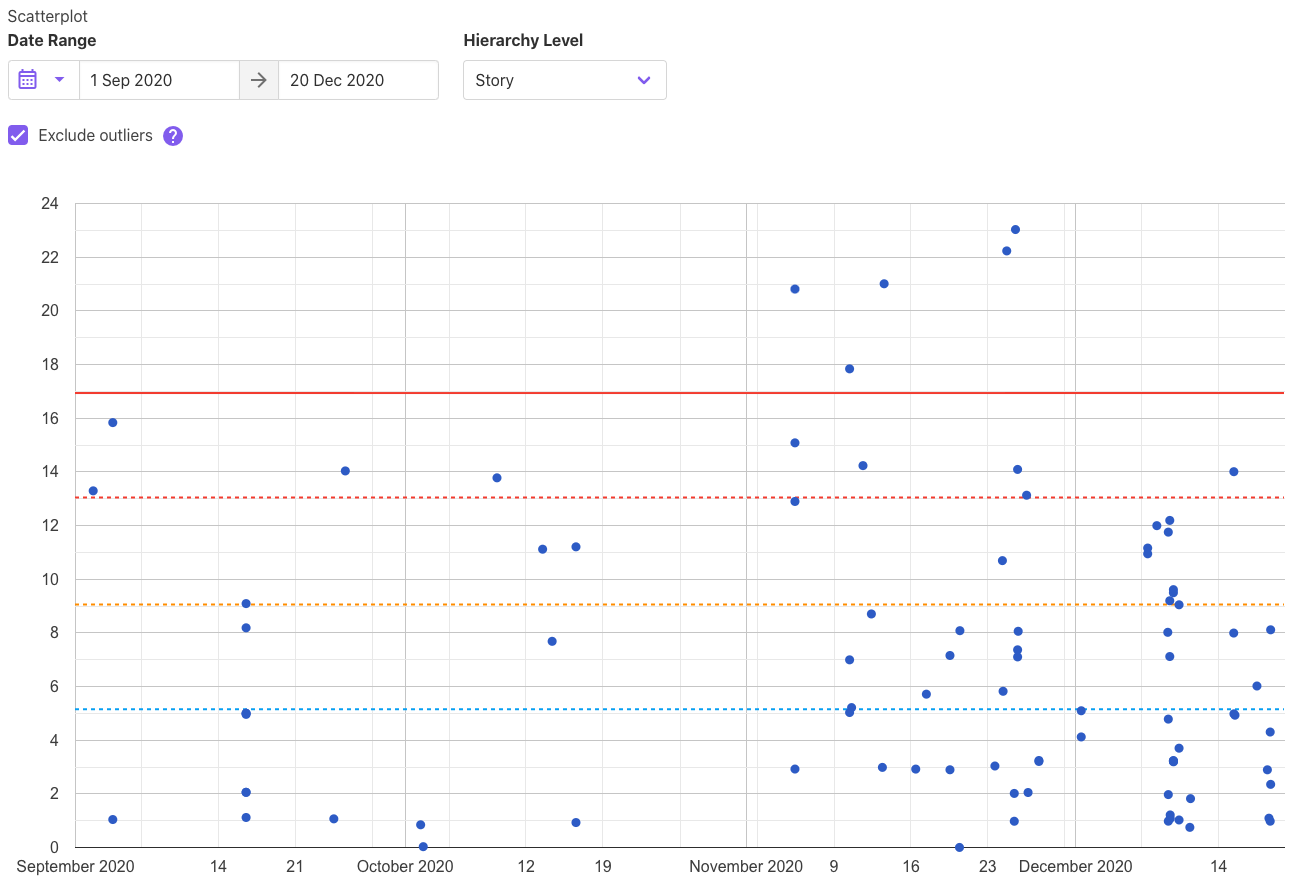
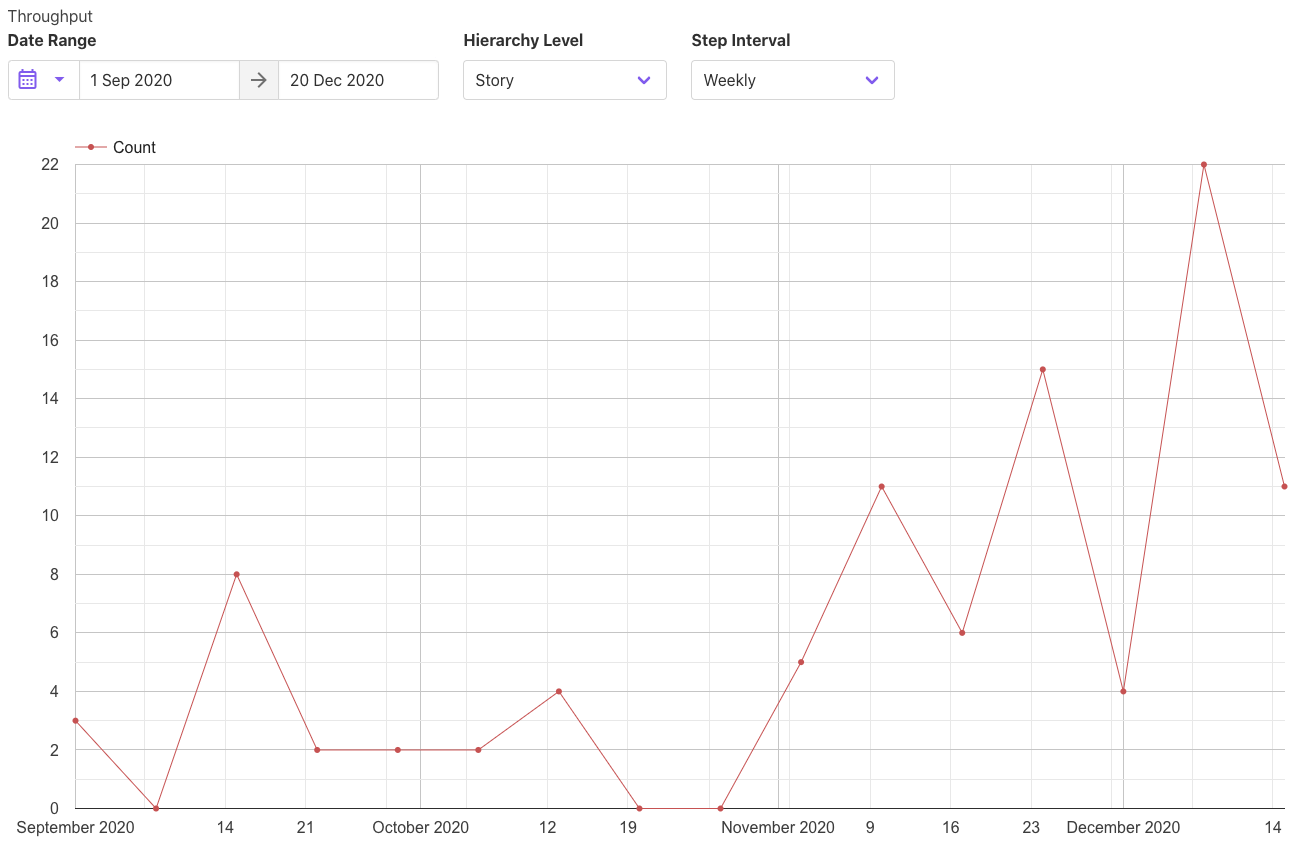
Specifically, it can produce cycle time scatterplots, throughput charts and cumulative flow diagrams in order to provide insight into process behavior and capabilities; and it can forecast using Monte Carlo methods to predict delivery times and costs for future work.
Inspired by Actionable Agile Metrics for Predictability by Daniel Vacanti.
Very much under development.
In software (and knowledge work more generally), management is often unaware of the capabilities of their processes. This ignorance manifests in unrealistic deadlines; unreasonable working hours; Management by Objectives and demoralizing annual reviews; projects which are late, over budget and poor in quality; and as burnout and fear in workers. As Deming observed:
If you have a stable system, there is no use to specify a goal. You will get whatever the system will deliver. A goal beyond the capability of the system will not be reached. If you have not a stable system, there is no point setting a goal. There is no way to know what the system will produce: it has no capability.
Deming provided his Fourteen Points as an alternative theory of management. However, project management tools common in software and other knowledge work fail to deliver on the promise of this theory:
- Project management software often fails to give management sufficient insight into the capabilities of processes (e.g. it focuses on flawed measurements such as story point velocity, rather than flow metrics like throughput and cycle times). It does not distinguish between common and special causes of variation.
- When charts are generated to provide insight, the math is sometimes incorrect because it assumes an underlying normal distribution to work item cycle times, when actually knowledge work tends to follow a Weibull distribution.
- Predictions are often based on flawed methods (e.g. averages) which fail to give true forecasts with probabilities, leaving management oblivious to risks of delay and cost overruns.
team-flow-metrics is an open source tool which attempts to provide useful, actionable data for process improvement, and meaningful forecasts with probabilities. Other tools provide these capabilities (notably those provided by Daniel Vacanti at actionableagile.com), but this project differs because:
- It is open source and free to use.
- While this is not yet implemented, it will be designed to be extremely configurable so that users can adapt the modelling and forecasting capabilities to their needs (e.g. to fit with different organizational designs and units of delivery).
- The downside to this, because it it a standalone tool, is that it requires separate deployment, and it cannot show data in realtime because it requires time to sync with external project management tools.
See the Getting Started docs for how to use.