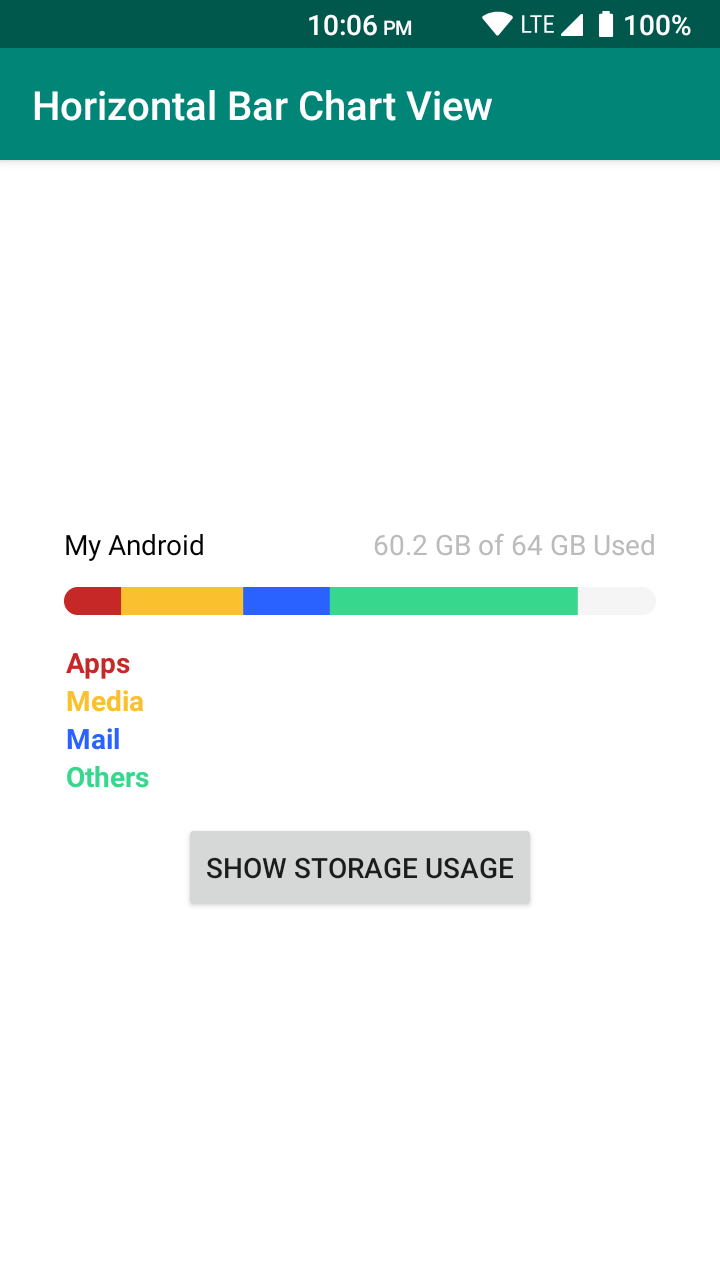
This library allows you to show a set of data over a horizontal bar. Just like the ones you see for example, in a device's Storage Usage.

To begin using HorizontalBarChartView in your projects just add the dependecy via Gradle or Maven.
- Add the library to the dependencies { ... } section of your app level
build.gradlefile:
dependencies {
    // ...
    implementation 'com.kishannareshpal:horizontalbarchartview:1.0.4'
    // ...
}-
Add the library as a dependency to your app level
build.gradlefile:<dependency> <groupId>com.kishannareshpal</groupId> <artifactId>horizontalbarchartview</artifactId> <version>1.0.4</version> <type>pom</type> </dependency>
HorizontalBarChartView can be implemented as a custom view to any layout. For more detailed code example to use the library, please refer to the sample /app .
<com.kishannareshpal.horizontalbarchartview.StorageDetailsView
	android:id="@+id/myChart"
	android:layout_width="match_parent"
    android:layout_height="12dp" />
By default, it will have a grey colored background with rounded corners, as seen above. In order to customize it, you can use the xml attributes listed on the table below:
| Name | Type | Description |
|---|---|---|
| hbcv_color | color | allows you to specify the default bar color. **Default value: #F5F5F5 **(Very light grey) |
| hbcv_cornerRadius | float | allows you to specify the radius of all four corners. Default value: 14F |
1. Add new data over the bar
In order to add a new data, use the addData() method to add as much as you want (but the percentage argument should not exceed a total of 100.0). Once you've done adding the data, call the show() method to update the chart with the new data.
void addData(int dataId, float percentage, int colorRes);
/* Arguments;
	• dataId – An arbitrary id, so you can query it's information later, such as it's percentage via the 'getDataPercentage()' method.
	• percentage – How much of the bar this data will fill, starting from the last added data. (Tip: In order to get the percentage you may use the function provided after this). For example: 42F.
	• colorRes – reference for the background color of this new detail.  For example: R.color.blue.
*/

// Finally ...
void show();
Tip: You may use this function to determine the percentage for your values:
// This will calculate the percentage for yourValue over the maxValue.
private float toPercentage(long yourValue, long maxValue){
    return yourValue * 100F / maxValue;
}

/**
Usage:
	float perc = toPercentage(20, 100);
	// perc = 20.0
*/
🥚Example:
// Define and initialize the view
HorizontalBarChartView hbcv = findViewById(R.id.hbcv);

// Add the data.
int percent = 12;
int color = R.color.blue;
hbcv.addData(MEDIA_ID, percent, color);

int percent = 35;
int color = R.color.green;
hbcv.addData(APPS_ID, percent, color);

// And finally call the .show() to update the bar.
sdv.show();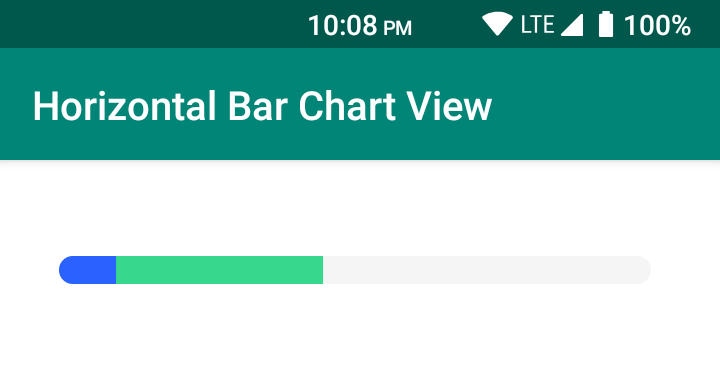
// Returns the percentage of an added data via its Id:
float getDataPercentage(int dataId);

// Returns the list of all added data.
// MyData :: provides `int getId()` and `float getPercentage()`
List<MyData> getAllData();
🥚Example:
// ... based of the last example. Continuing from it ...

// to get the APPS_ID percentage:
float apps_percentage = hbcv.getDataPercentage(APPS_ID);
Log.v("hbcv", "Your apps percentage is: " + apps_percentage + "%");
/*
	Result:
	- hbcv: "Your apps percentage is: 12.0%"
*/


// to get all of the data you've added as a list:
List<MyData> myDataList = getAllData();
int dataCount = myDataList.size(); // get a count of how much data you've added
Log.v("hbcv", "Data Count: You have a total of " + dataCount + ".");

// Itterate through all of the details on the list.
for(MyData myData: myDataList){
    Log.v("hbcv", "Id: " + myData.getId());
    Log.v("hbcv", "Percentage: " + myData.getPercentage());
}
/*
	Result:
	- hbcv: "Count: You have added 2 details.";


	- hbcv: "Id: MEDIA_ID";
    - hbcv: "Percentage: 12.0%";

    - hbcv: "Id: APPS_ID";
    - hbcv: "Percentage: 35.0%";
*/Copyright 2017 Kishan Nareshpal Jadav
Licensed under the Apache License, Version 2.0 (the "License");
you may not use this file except in compliance with the License.
You may obtain a copy of the License at
http://www.apache.org/licenses/LICENSE-2.0
Unless required by applicable law or agreed to in writing, software
distributed under the License is distributed on an "AS IS" BASIS,
WITHOUT WARRANTIES OR CONDITIONS OF ANY KIND, either express or implied.
See the License for the specific language governing permissions and
limitations under the License.