
We all like to travel. There are some people who plan trips and others leave on a whim without tangible plans.
For this project, my goal was to provide information and provide a summary which will help out target audience make effective decisions while travelling.
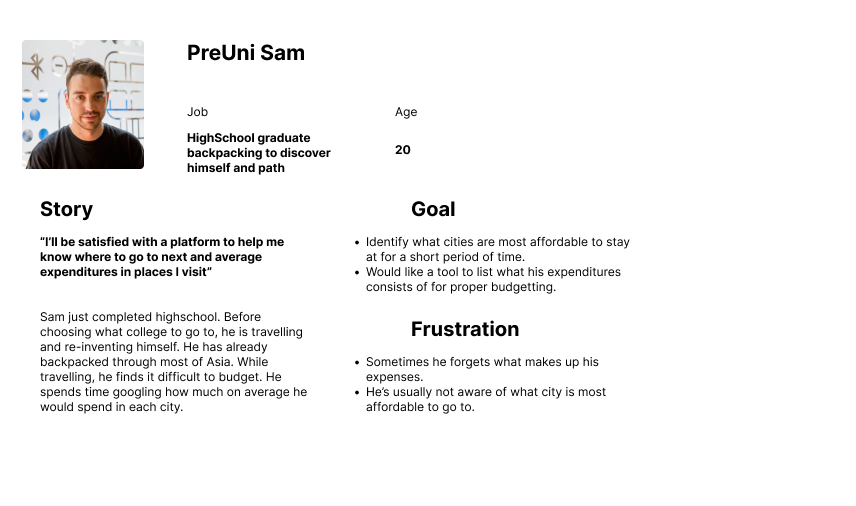
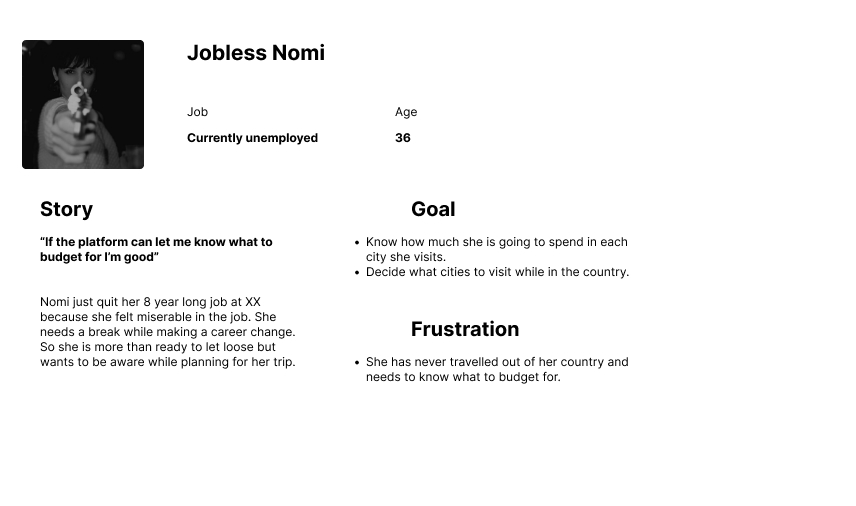
- Hitch Hikers 🥾.
Numbeo is a cost of living database. It is a crowd-sourced global database of quality of life data including housing indicators, perceived crime rates, healthcare quality, transport quality, and other statistics.

Though the data is available on Numbeo and is reliable becuase the data is provided by the population, the issue I find with the platform is the difficulty of use. To use this platform, the user has to navigate the map to get a summary statistic after for a particular indicator.
With this project, I hope to provide a prototype of a platform which provides more insights which are more readily available and easier to access.
Data for this project is taken from Numbeo a crowd-sourced cost of living database for the year 2021.
After gathering the data; I did some transforms and merges to end up with the final dataset.
Tools used:
- 📕 Notebook and 🖋️ Pen
- 🐍 Python [Data manipulation]
- Adobe Illustrator [Visualization]
- Tableau
- Merged multiple sheets,
- Converted columns to categorical where necessary.
Notebook
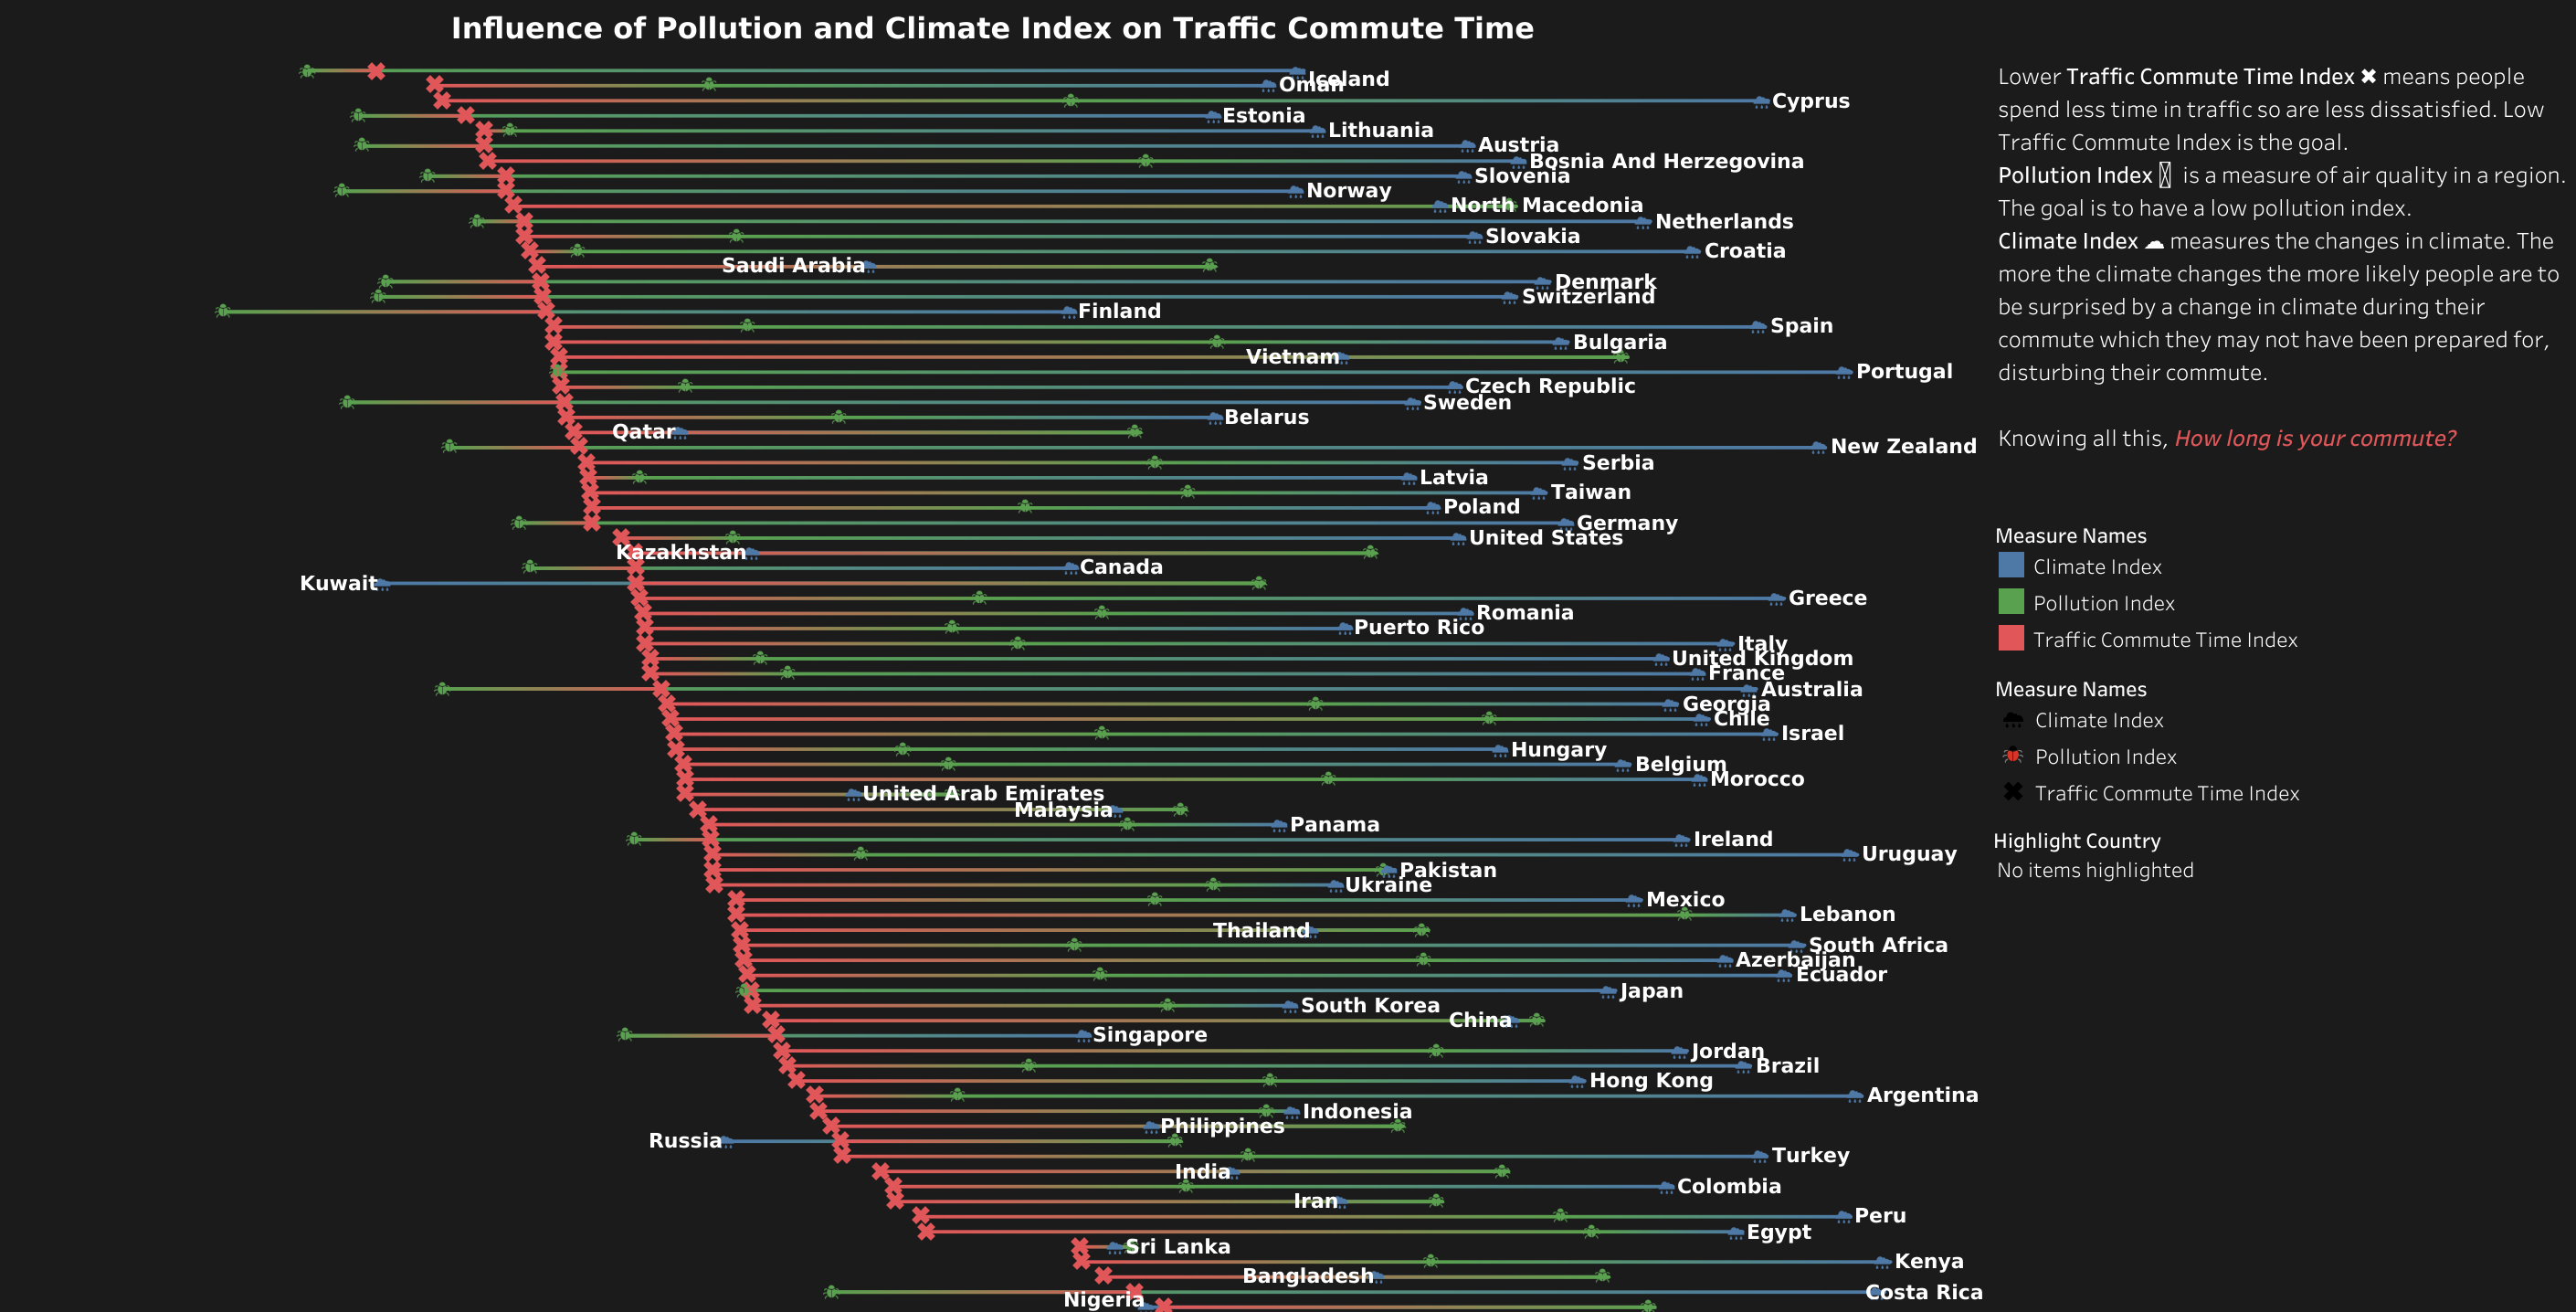
- Transportation 🚍
Normally, I will assume Climate Index and Pollution Index have an effect on commute time.
So I decided to check the correlation and covariance of Traffic Commute Time Index, Pollution Index and Climate Index.
I noticed the covariance of:- Traffic Commute Time Index and Pollution Index: 0.9020864451308938.
- Traffic Commute Time Index and Climate Index: 0.8992827901260081.
So these 2 variables are linearly related to Traffic Commute Time Index as earlier assumed.
In the course of manipulating the data I noticed some NULL values and decided to filter out those countries.


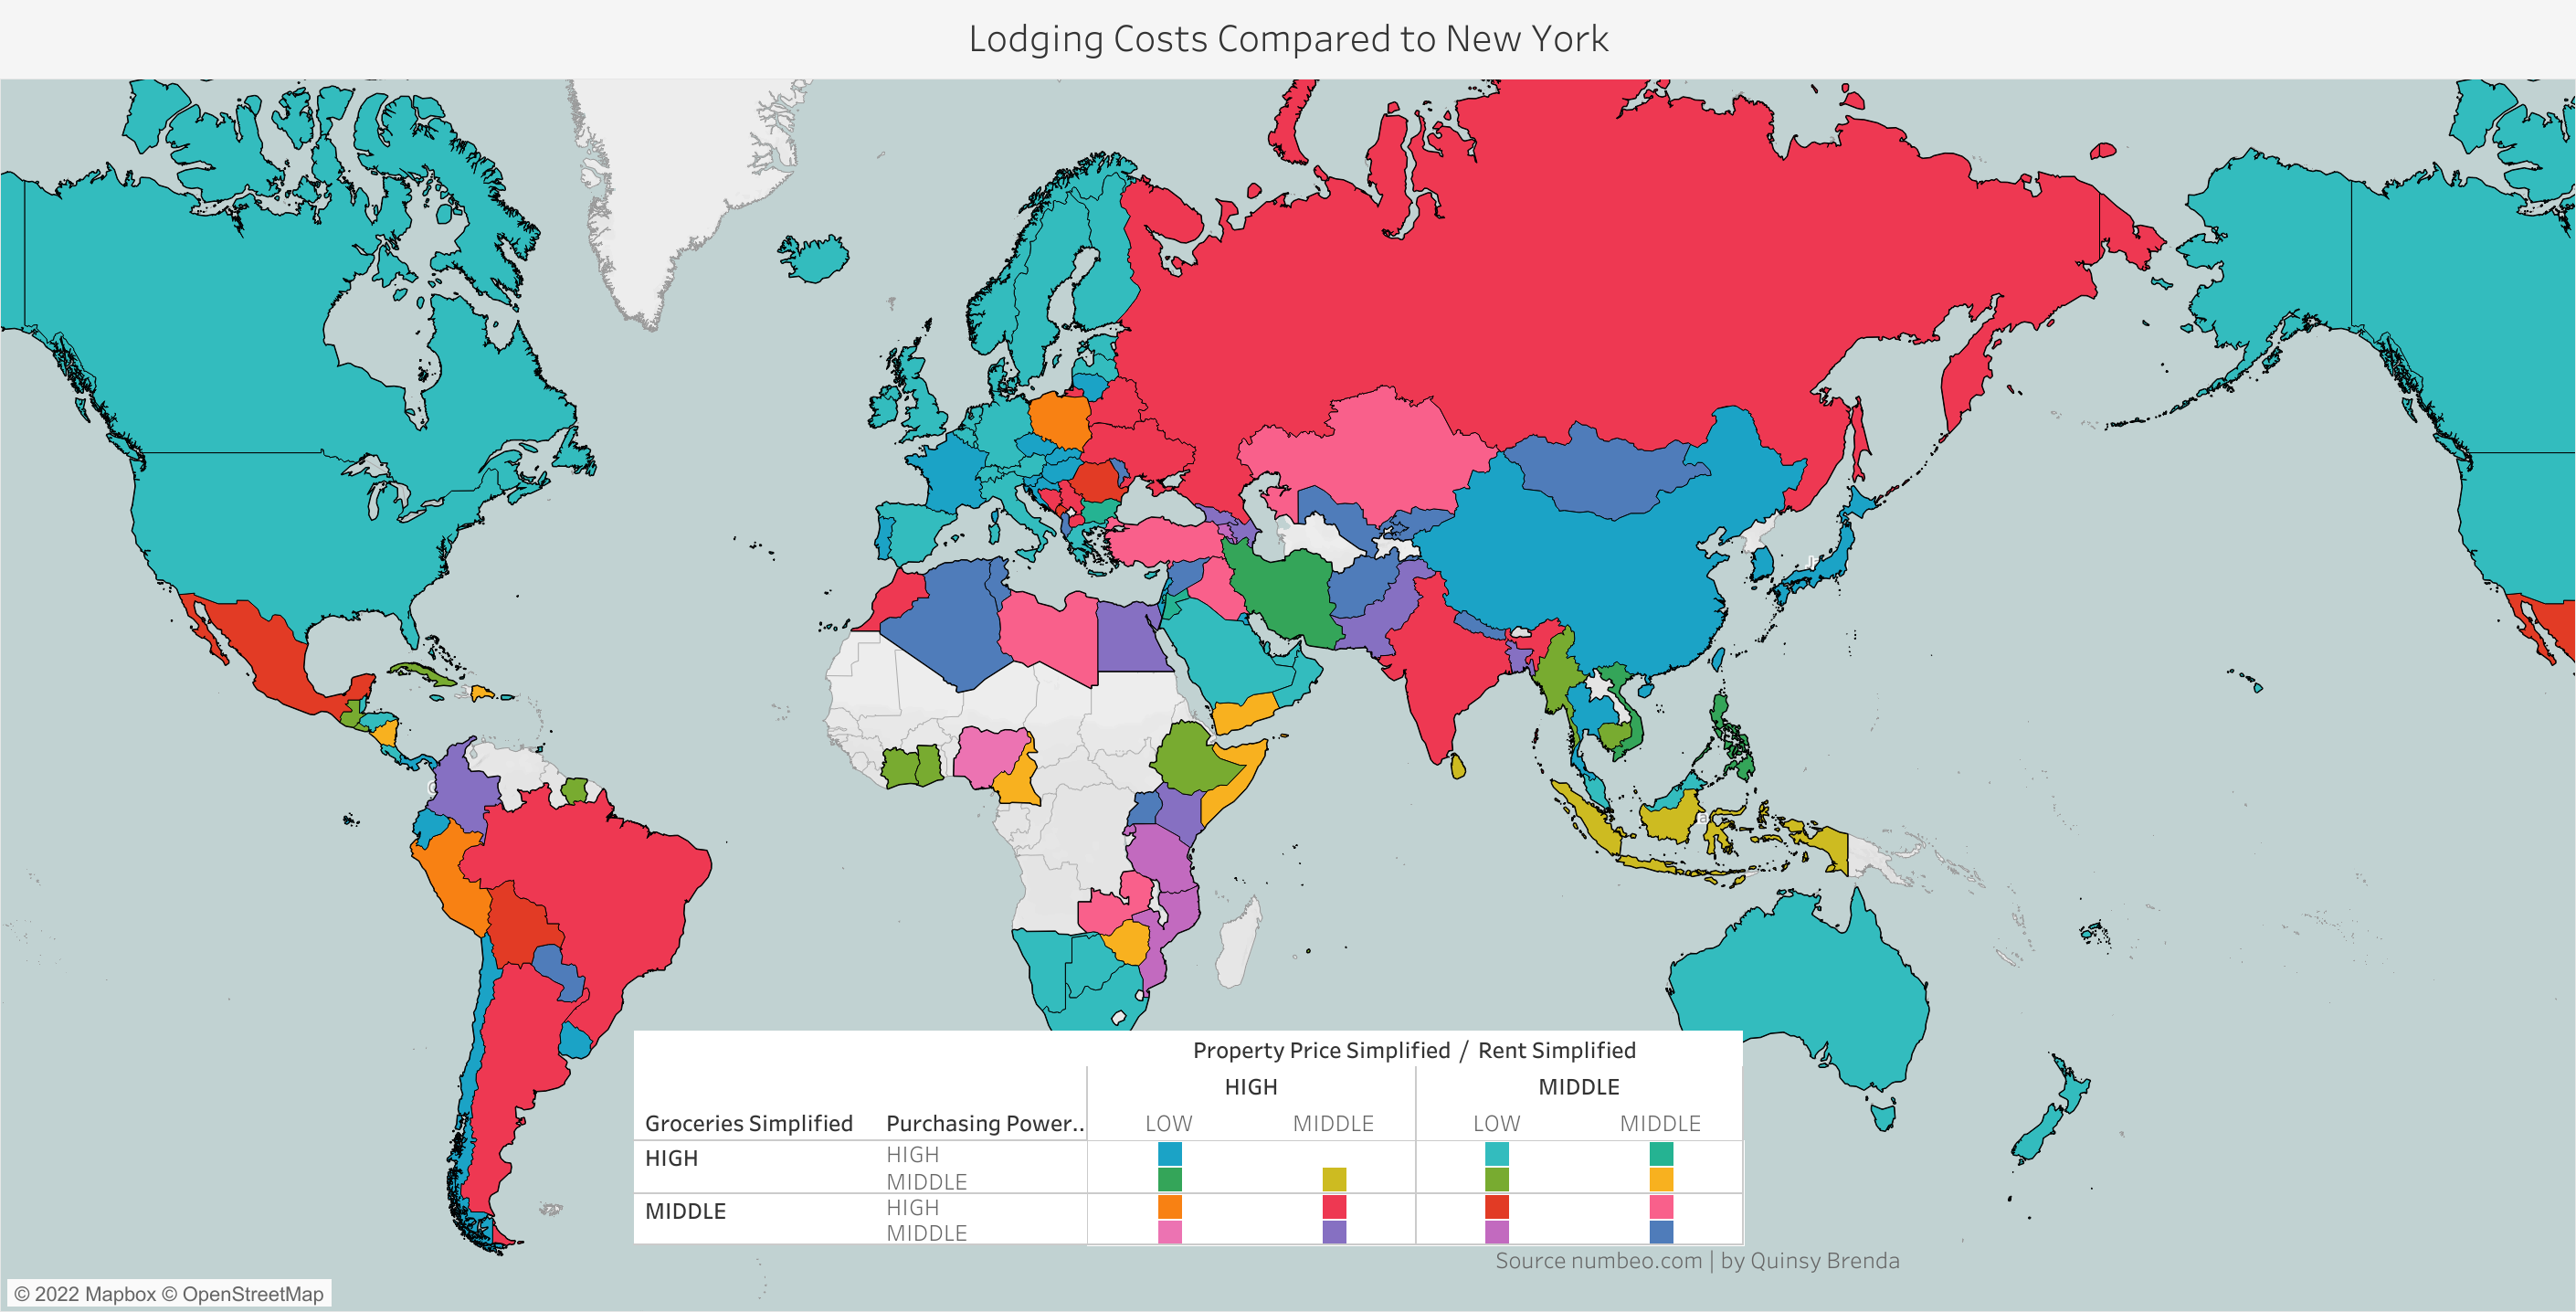
- Lodging 🏚️
For Lodging I considered the- Country
- Rent Index
- Groceries Index
- Property Price to Income Ratio
- Local Purchasing Power Index.
columns.
I thought these 3 variables should influence choice when going for a place to stay.
The data here had 138 countries considered here.
👉Resulting Dashboard
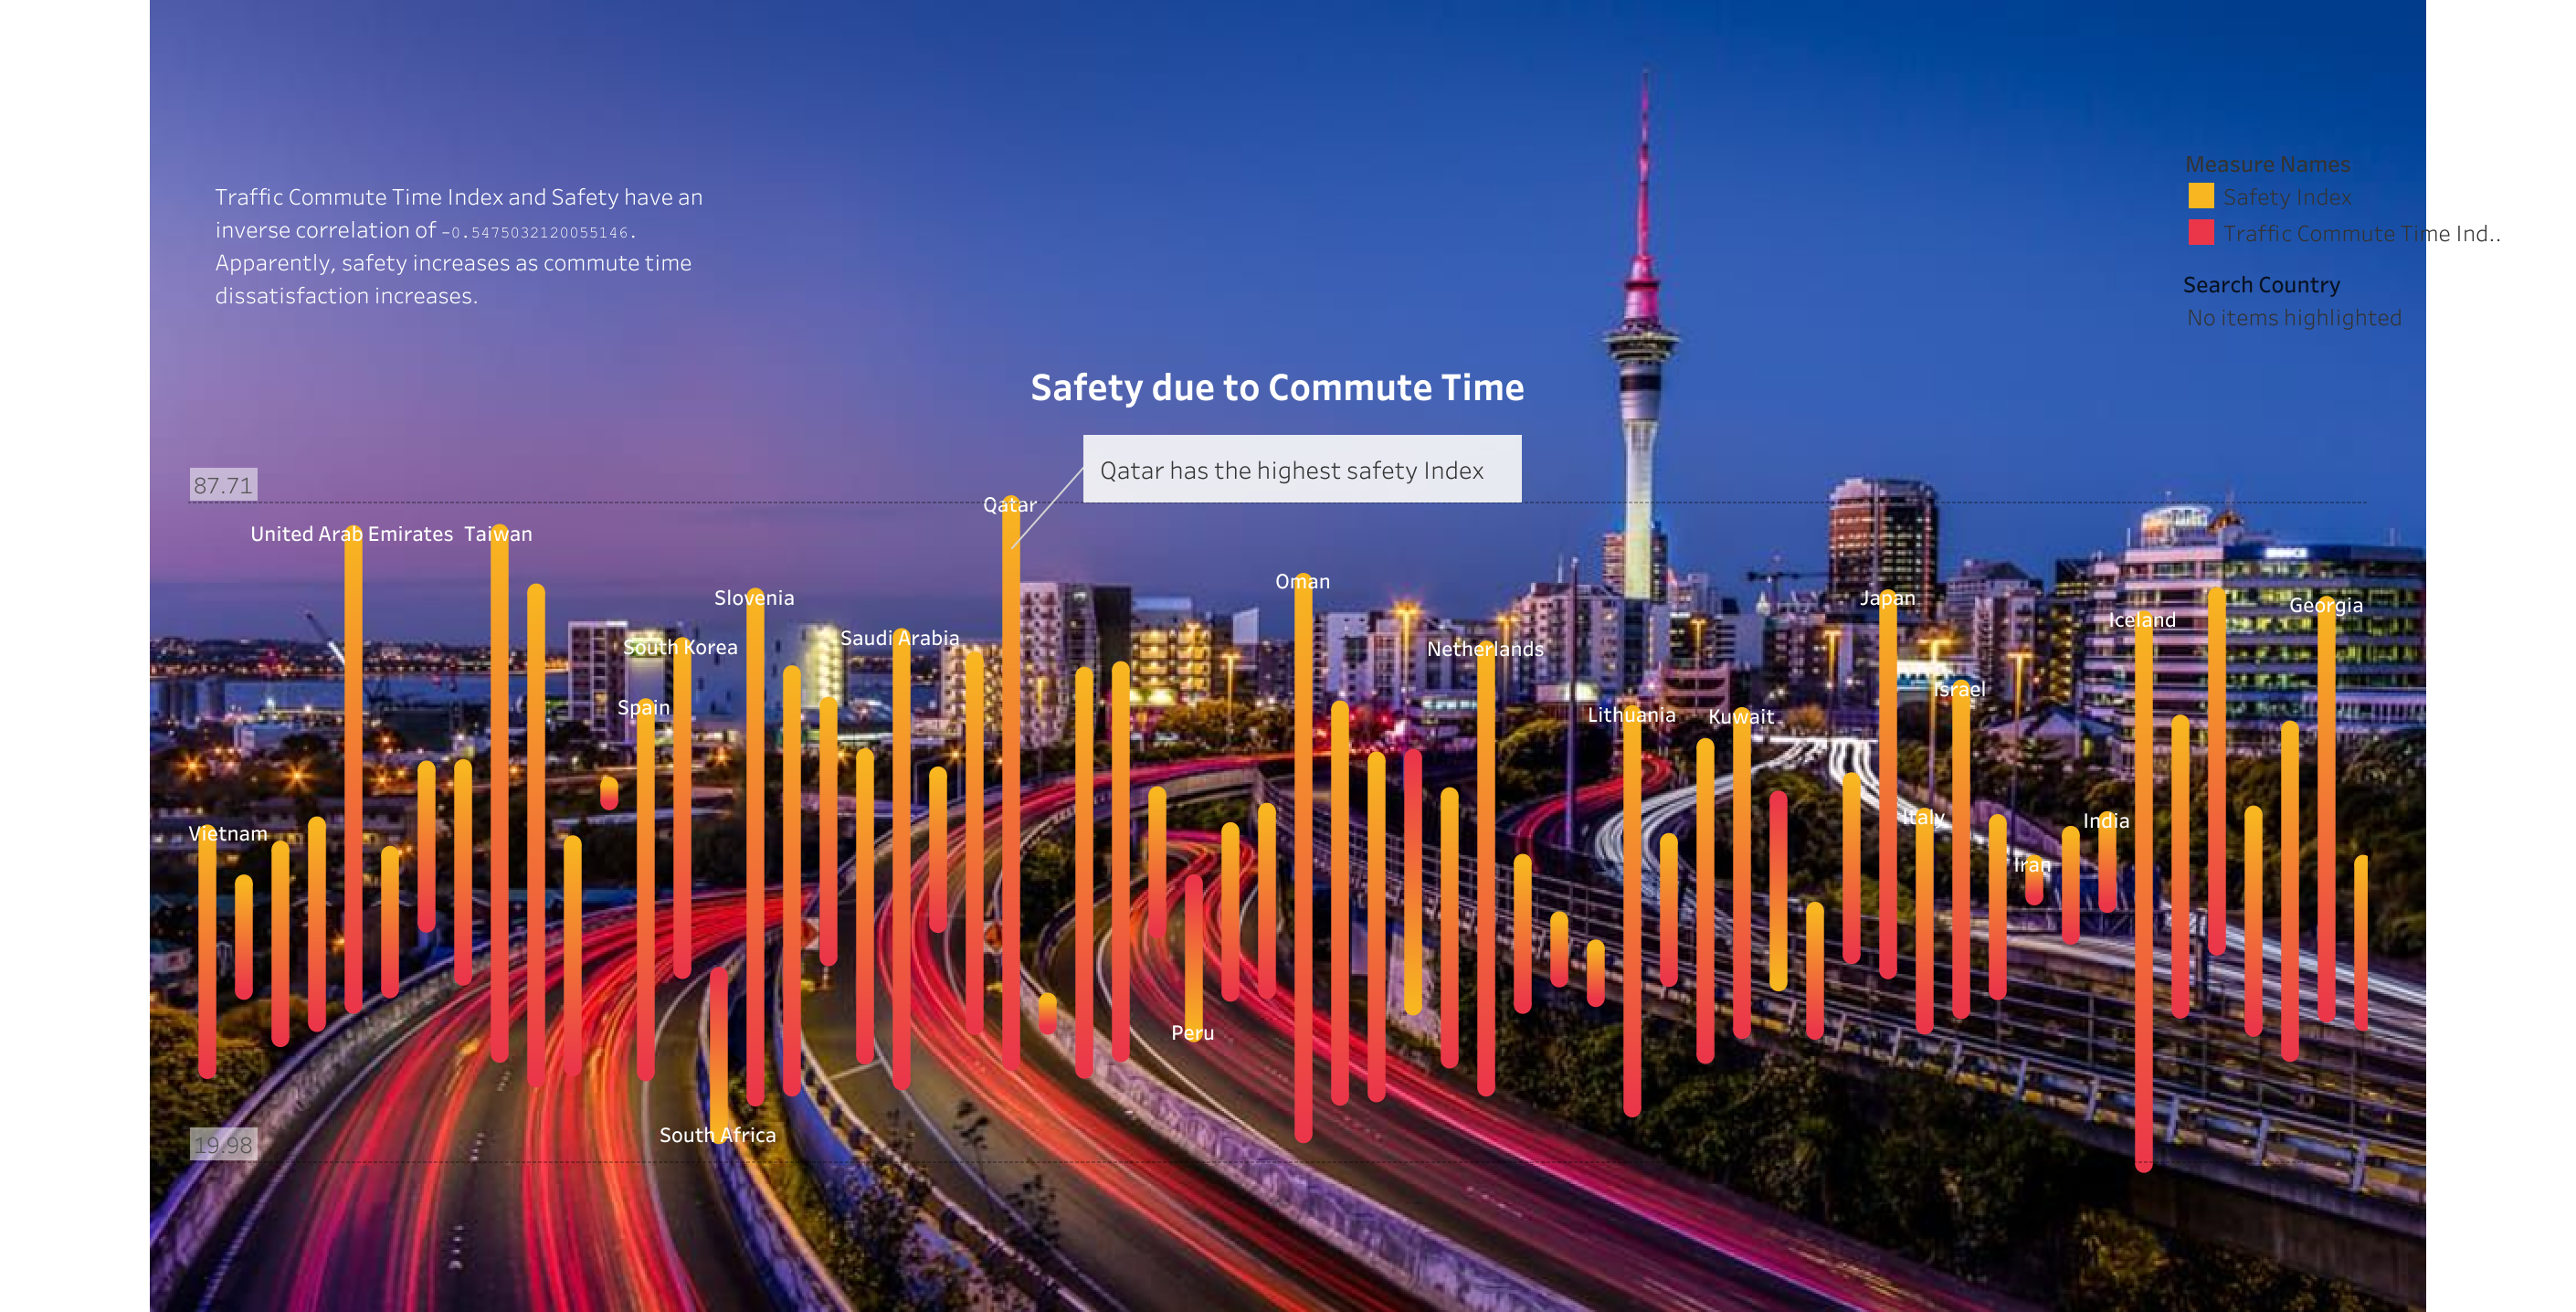
- Safety 👮
It made sense to me that Safety should be influenced by traffic commute time.
I wanted to look at the correlation of traffic commute and safety and got a value of -0.5475, which seems to me like they are inversely related.

So i chose to plot it ...
 👉Resulting Dashboard
- Weather 🌦️
How often does the weather change? Some countries have super spontaneous weathers while others are more predictible.


From the plots I don't see any statistical proof of linearity between the variables.
I decicided to be extra sure and calculate the correlation coefficient :
- Restaurant Price Index and Safety Index have a correlation coefficient of 0.27162826173619786.
- Restaurant Price Index and Climate Index have a correlation coefficient of 0.2014795908896057.
From these results, I would say:
- Climate Index and Pollution Index are linearly related to Traffic Commute Time Index.
- Rent Index, Groceries Index, Property Price to Income Ratio and Local Purchasing Power Index have no statistical proof of linearity.
The resulting platform would provide summary data for the user.


In the future, I hope to provide an MVP of the product, get access to an api through which to pull the data from and automate the process.