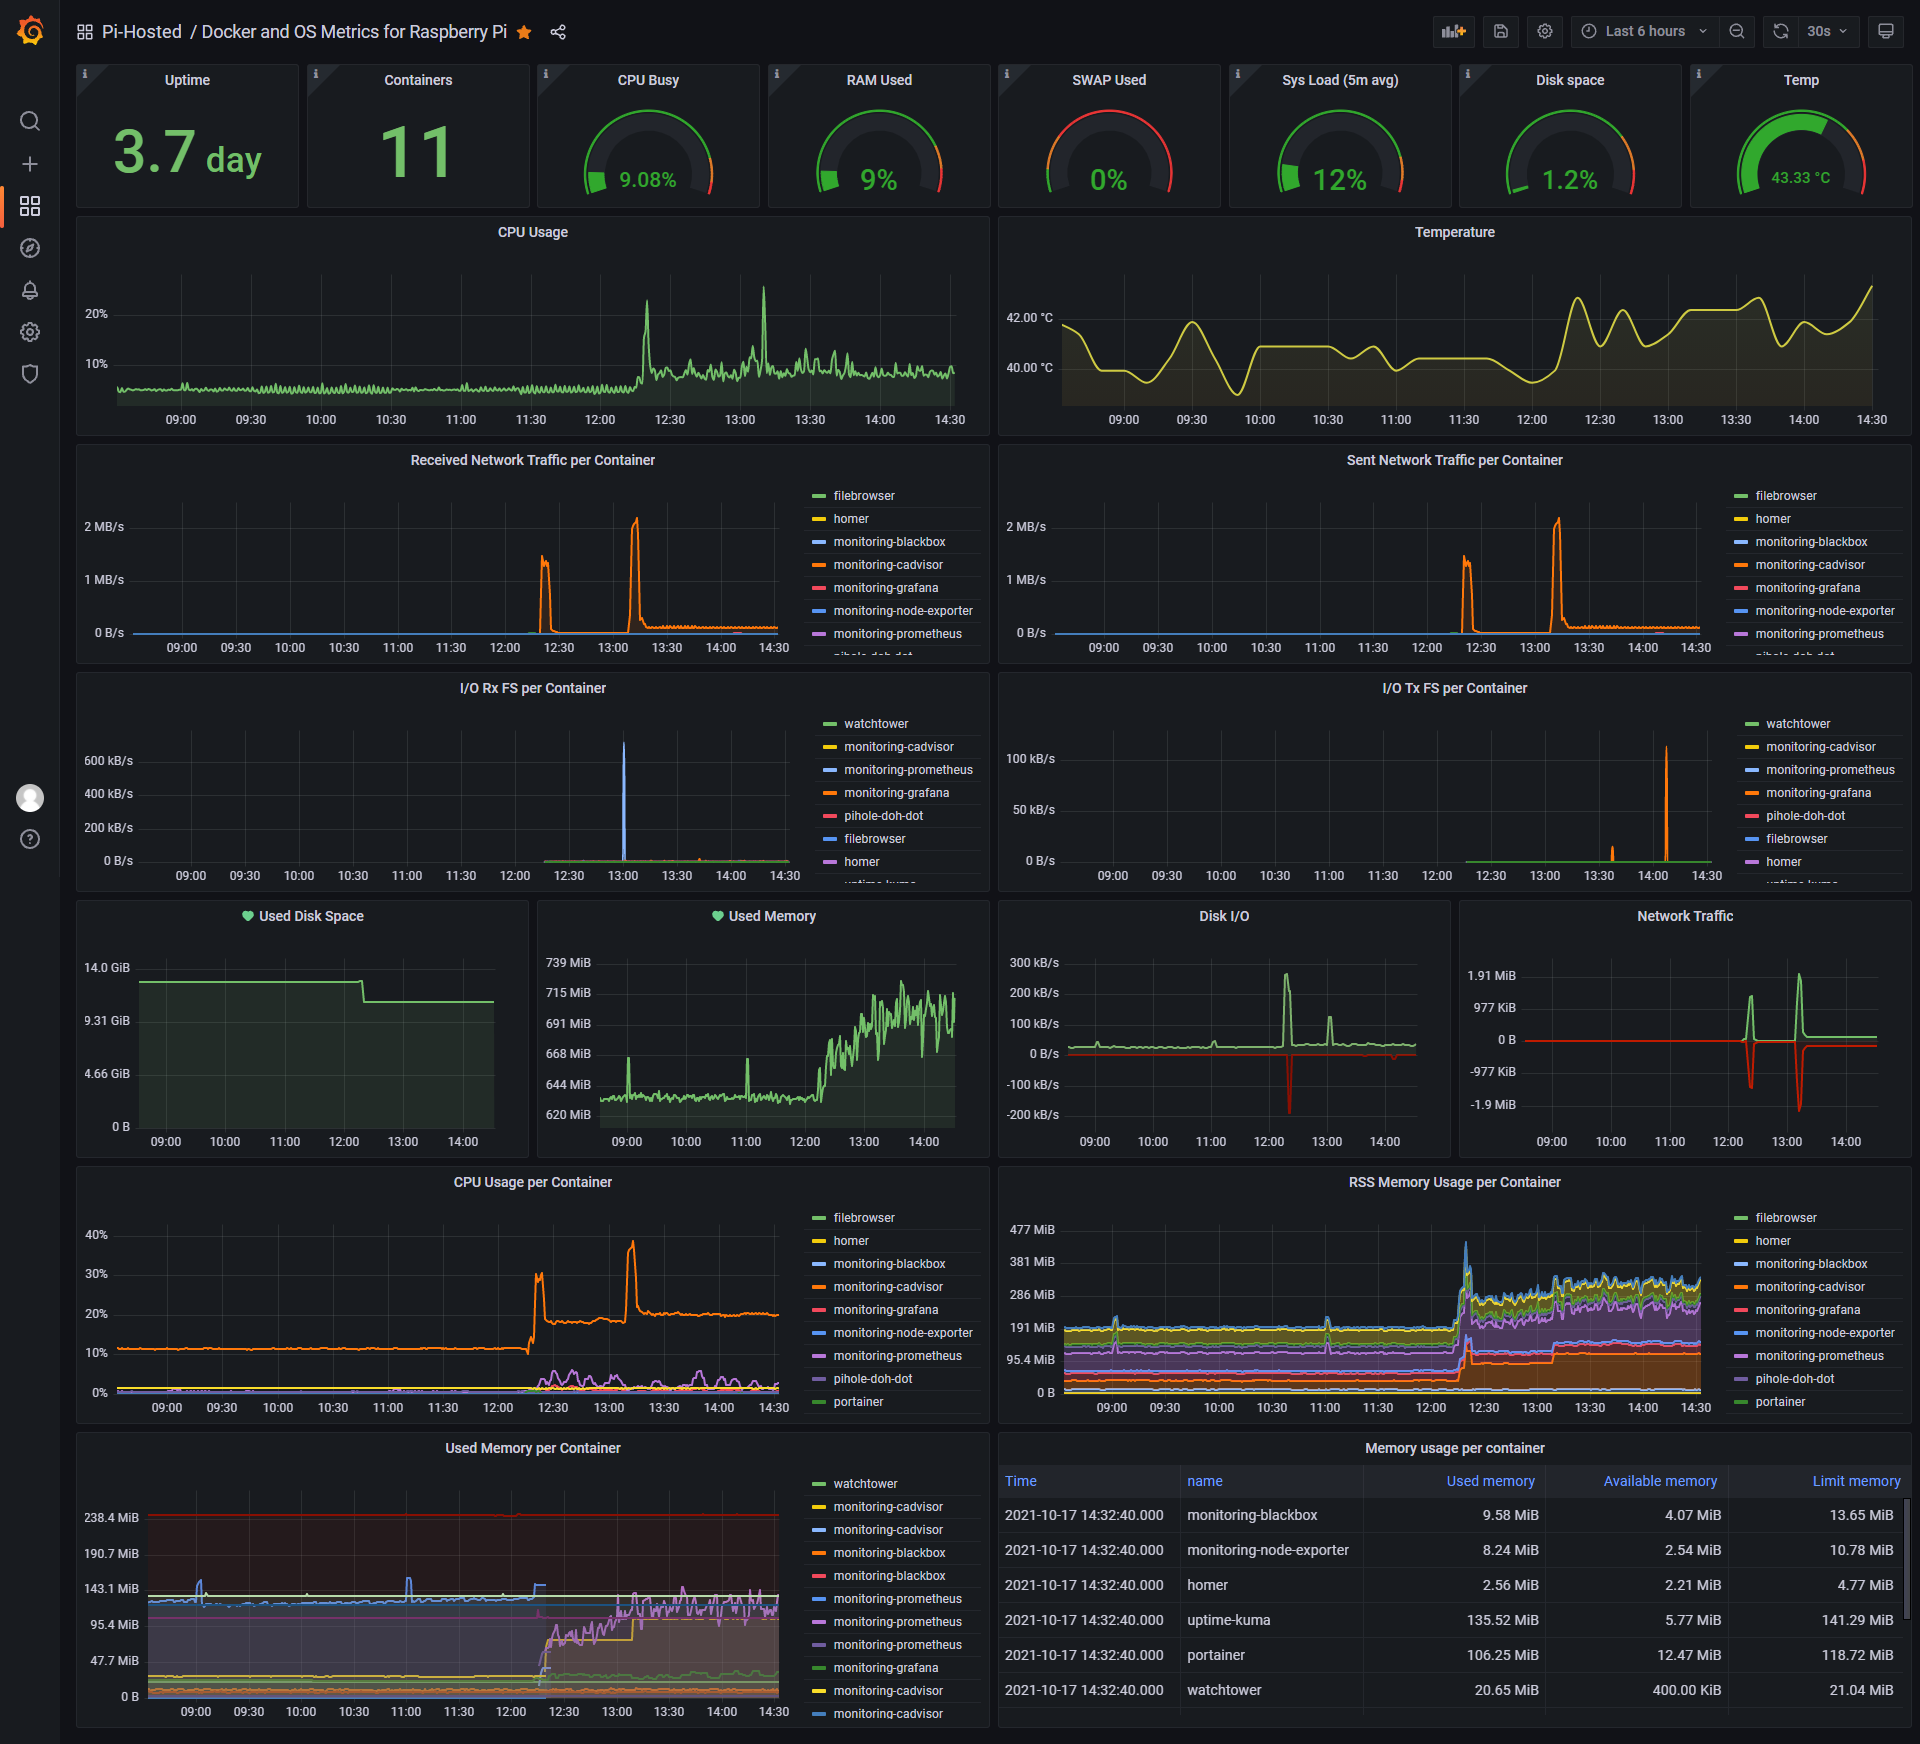
A monitoring solution for Docker hosts and containers with Prometheus, Grafana, cAdvisor, NodeExporter.
You can download this dashboard at Grafana Dashboard Community
First SSH into your Pi and there is one thing we need to do before we get cracking. We need to enable c-groups so the stack will work out of the box. To do this you need to modify the configuration file /boot/cmdline.txt:
sudo nano /boot/cmdline.txt
And add the following options:
cgroup_enable=memory cgroup_memory=1
Now save the file in your editor and reboot:
sudo reboot
Then clone this repository on your Pi host, cd into Docker-Raspberry-PI-Monitoring directory and run docker-compose up:
git clone https://github.com/oijkn/Docker-Raspberry-PI-Monitoring.git
cd Docker-Raspberry-PI-Monitoring
docker-compose up -d
Containers:
- Prometheus (metrics database) http://:9090
- Grafana (visualize metrics) http://:3000
- NodeExporter (host metrics collector)
- cAdvisor (containers metrics collector)
Navigate to http://<host-ip>:3000 and login with user admin password admin. You can change the credentials in the compose file or by supplying the ADMIN_USER and ADMIN_PASSWORD environment variables on compose up.
GF_SECURITY_ADMIN_USER=admin
GF_SECURITY_ADMIN_PASSWORD=changeme
GF_USERS_ALLOW_SIGN_UP=false
Grafana is not preconfigured with dashboard, so you have to import it from the json file. And set Prometheus as the default data source.
Grafana > Configuration > Data Sources > Prometheus

scrape_configs:
  - job_name: 'prometheus'
    scrape_interval: 30s
    static_configs:
      - targets: ['localhost:9090', 'cadvisor:8080', 'node-exporter:9100']