

Charts include the following libraries & types by default:
- ChartJS
chartjs- Area Chart
area - Line Chart
line - Bar Chart
bar - Pie Chart
pie - Donut / Doughnut Chart
donut
- Area Chart
- Highcharts
highcharts- Area Chart
area - Line Chart
line - Bar Chart
bar - Pie Chart
pie - Donut / Doughnut Chart
donut - Geo Chart
geo
- Area Chart
- Google Charts
google- Area Chart
area - Line Chart
line - Bar Chart
bar - Pie Chart
pie - Donut / Doughnut Chart
donut - Geo Chart
geo
- Area Chart
- Chartist
chartist- Area Chart
area - Line Chart
line - Bar Chart
bar - Pie Chart
pie - Donut / Doughnut Chart
donut
- Area Chart
- FusionCharts
fusioncharts- Area Chart
area - Line Chart
line - Bar Chart
bar - Pie Chart
pie - Donut / Doughnut Chart
donut
- Area Chart
- Morris JS
morris- Area Chart
area - Line Chart
line - Bar Chart
bar - Donut / Doughnut Chart
donut
- Area Chart

To install charts use composer
composer require consoletvs/charts
Add the following service provider to the array in: config/app.php
ConsoleTVs\Charts\ChartsServiceProvider::class,
Add the following alias to the array in: config/app.php
'Charts' => ConsoleTVs\Charts\Charts::class,
php artisan vendor:publish --tag=charts_config
php artisan vendor:publish --tag=charts_assets --force
The file in: config/charts.php contains an array of settings, you can find the default settings in there.
Example Controller:
<?php

namespace App\Http\Controllers;

use Illuminate\Http\Request;

use App\Http\Requests;
use Charts;

class TestController extends Controller
{
    public function index()
    {
		$chart = Charts::new('line', 'highcharts')
			->setTitle('My nice chart')
			->setLabels(['First', 'Second', 'Third'])
			->setValues([5,10,20])
			->setDimensions(1000,500)
			->setResponsive(false);
		return view('test', ['chart' => $chart]);
    }
}
Example View:
<!DOCTYPE html>
<html lang="en">
    <head>
        <meta charset="utf-8">
        <meta http-equiv="X-UA-Compatible" content="IE=edge">
        <meta name="viewport" content="width=device-width, initial-scale=1">

        <title>My Charts</title>

		{!! Charts::assets() !!}

    </head>
    <body>
        <center>
			{!! $chart->render() !!}
		</center>
    </body>
</html>
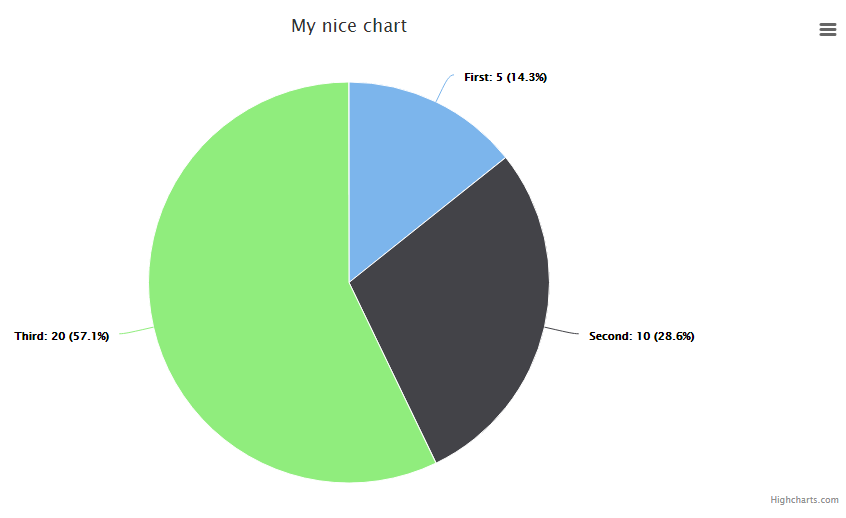
Note: highcharts can't change the color of this chart. Well it can but it's complicated, so I leave it here.
Charts::new('pie', 'highcharts')
	->setTitle('My nice chart')
	->setLabels(['First', 'Second', 'Third'])
	->setValues([5,10,20])
	->setDimensions(1000,500)
	->setResponsive(false);
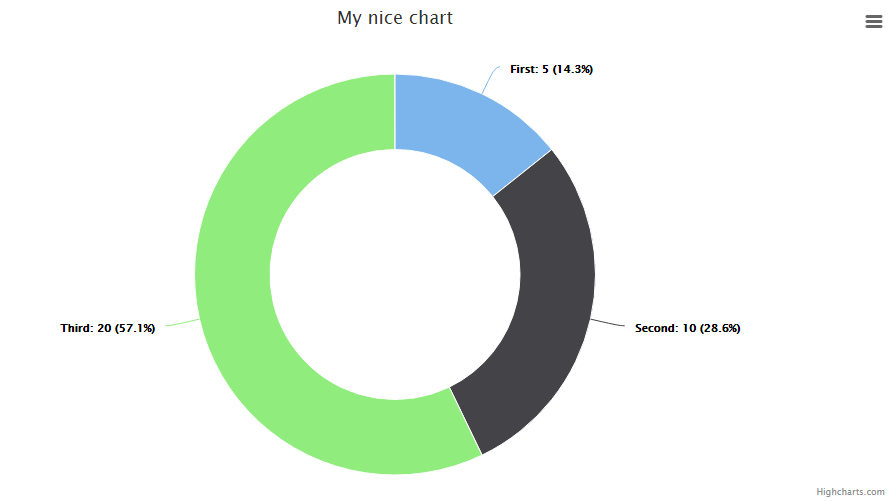
Note: highcharts and chartist can't change the color of this chart. Well they can but it's complicated, so I leave it here.
Charts::new('donut', 'highcharts')
	->setTitle('My nice chart')
	->setLabels(['First', 'Second', 'Third'])
	->setValues([5,10,20])
	->setDimensions(1000,500)
	->setResponsive(false);
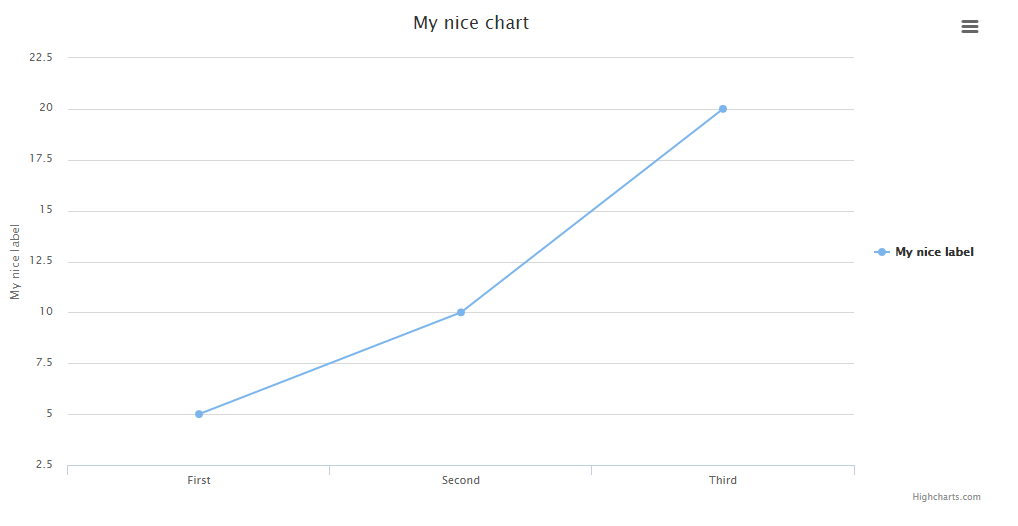
Charts::new('line', 'highcharts')
	->setTitle('My nice chart')
	->setElementLabel('My nice label')
	->setLabels(['First', 'Second', 'Third'])
	->setValues([5,10,20])
	->setDimensions(1000,500)
	->setResponsive(false);
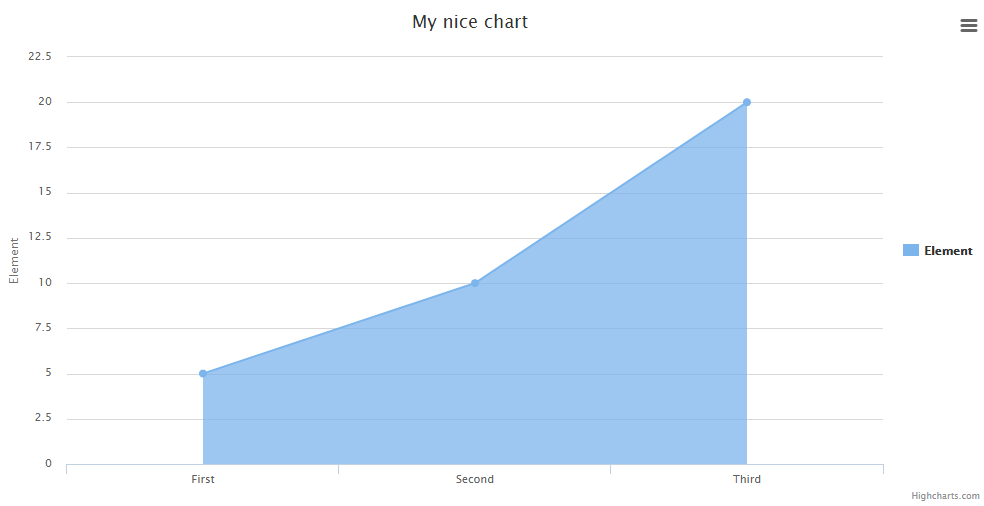
Charts::new('area', 'highcharts')
	->setTitle('My nice chart')
	->setElementLabel('My nice label')
	->setLabels(['First', 'Second', 'Third'])
	->setValues([5,10,20])
	->setDimensions(1000,500)
	->setResponsive(false);
Note: highcharts can't change the color of this chart. Well it can but it's complicated, so I leave it here.
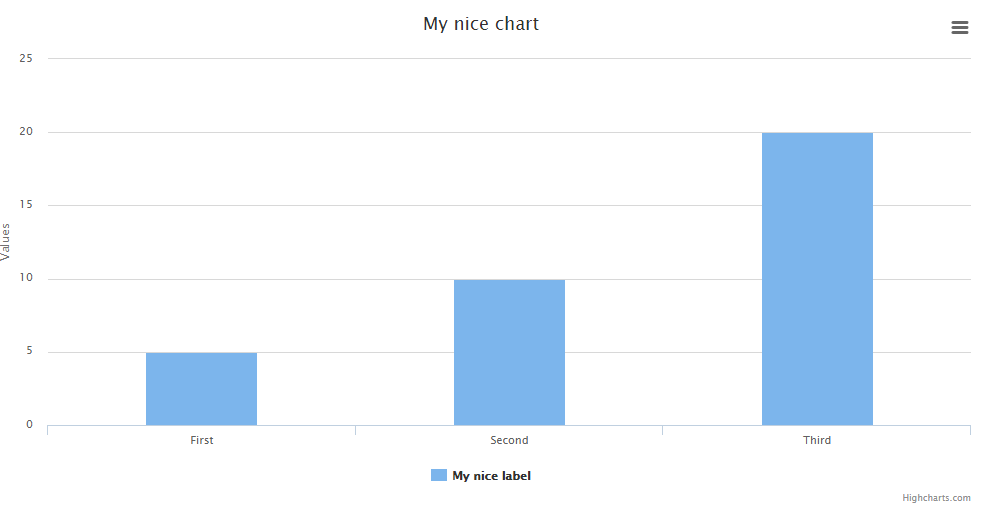
Charts::new('bar', 'highcharts')
	->setTitle('My nice chart')
	->setElementLabel('My nice label')
	->setLabels(['First', 'Second', 'Third'])
	->setValues([5,10,20])
	->setDimensions(1000,500)
	->setResponsive(false);
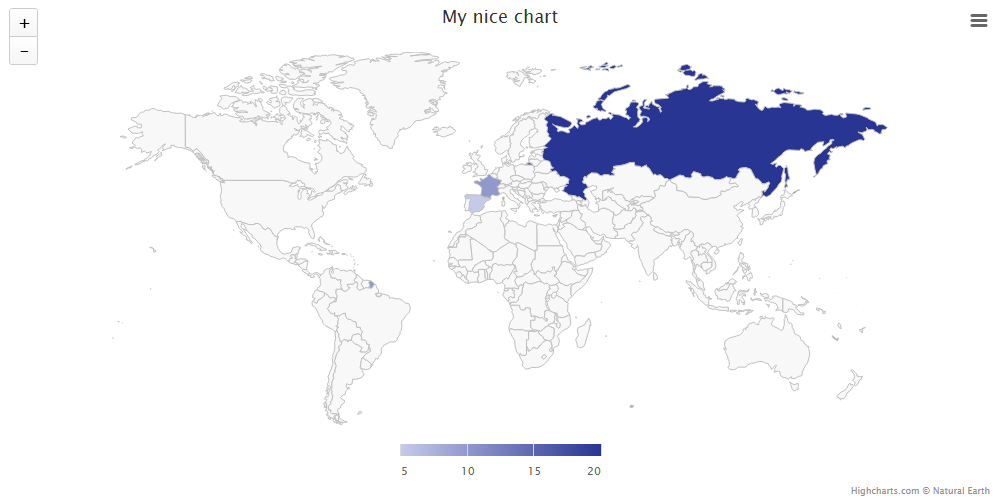
Note: The labels must have the country codes, not the name.
Note 2: To add color to the chart, you'll need to provide an array of at least 2 colors. The first is the min and the second the max.
Charts::new('geo', 'highcharts')
	->setTitle('My nice chart')
	->setElementLabel('My nice label')
	->setLabels(['ES', 'FR', 'RU'])
	->setColors(['#C5CAE9', '#283593'])
	->setValues([5,10,20])
	->setDimensions(1000,500)
	->setResponsive(false);
-
new()
Returns a new chart instance, if no library is specified, the default one will be used.
Charts::new('line''); Charts::new('line', 'highcharts'); -
assets()
Returns all the assets to generate the graphs.
<?php echo Charts::assets(); ?> // using blade {!! Charts::assets() !!} -
libraries()
Returns an array of all the libraries available (can be filtered)
// Return all the libraries available print_r(Charts::libraries()); // Return all the libraries available for the line chart print_r(Charts::libraries('line')); -
types()
Returns an array of all the chart types available (can be filtered)
// Return all the chart types available
print_r(Charts::types());

// Return all the chart types available for the highcharts library
print_r(Charts::libraries('highcharts'));
-
setType()
Set the chart type after creation (Example: from line to pie)
Charts::new('line', 'highcharts')->setType('pie'); -
setLibrary()
Set the chart library after creation (Example: from highcharts to google)
Charts::new('line', 'highcharts')->setLibrary('google'); -
setLabels()
The labels of the chart
Charts::new('line', 'highcharts')->setLabels(['First', 'Second', 'Third']); -
setValues()
The values of the chart respectively
Charts::new('line', 'highcharts')->setValues([10, 50, 100]); -
setElementLabel()
The element label for line / bar / geo charts
Charts::new('line', 'highcharts')->setElementLabel('Total Views'); -
setTitle()
The chart title
Charts::new('line', 'highcharts')->setTitle('My Chart'); -
setColors()
The colors of the charts respectively
Charts::new('line', 'highcharts')->setColors(['#ff0000', '#00ff00', '#0000ff']); -
setWidth()
The chart width if non-responsive
Charts::new('line', 'highcharts')->setWidth(1000); -
setHeight()
The chart height if non-responsive
Charts::new('line', 'highcharts')->setHeight(500); -
setDimensions()
The chart dimensions (shortcut to set width, height with one funcion)
Charts::new('line', 'highcharts')->setHeight(1000, 500); -
setResponsive()
Set if the chart is responsive or not. If not, the chart dimensions will be used.
Charts::new('line', 'highcharts')->setResponsive(false); -
settings()
Return the chart settings
print_r(Charts::new('line', 'highcharts')->settings()); -
render()
Render the chat!
echo Charts::new('line', 'highcharts')->setLabels(['One', 'Two'])->setValues([10, 20])->render();
You can create your own Charts by forking this repository. The src/Templates folder contains all the current charts, but you can
add yours like this:
Create a new file, the syntax is: library.type.php
if your chart library is called: mylib
and your template is for the line chart: line
Then you create a file like this: mylib.line.php
To call it later, just use:
$chart = Charts::new('line', 'mylib');
You have plenty of examples to see how to put the data so just take a closer look at all the included templates before doing yours!