Performance Tracing
TypeScript 4.1 introduced a generateTrace flag to make it easier to identify the parts of a program that are taking the most time to compile.
The output changed somewhat in TypeScript 4.2 and may change again. Please do not take dependencies on particular characteristics of the output.
Trace files are hard to consume without the underlying source code - at best an external investigator can tell you which of your files to examine more closely. If you do share them, please consider zipping them — they compress very well.
At present, the output is not very user friendly, but here are some steps you can take to identify the parts of your code that are slowing the compiler down. The goal of this process is to be able to extract a reduced repro for which you can file an issue.
-
--generateTracewas introduced in TypeScript 4.1, so you'll need to install a compatible version of TypeScript. The easiest way is tonpm install typescript@latest. Note that there's no need to retain/merge the newer version of TypeScript after you've generated the trace. -
Rebuild your project with the newly installed version of Typescript. Odds are you're going to get some new compiler errors. Ideally, you'll want to address these new errors, so that the code you trace will be realistic. If that is not feasible, prefer
@ts-ignoretoany, because it will cause less short-circuiting. -
Once your project builds without errors, compile your project with
tscand--generateTrace some_directory. You can use.as the directory, but it may get cluttered, so a subdirectory is usually preferable. In this early version of the feature, you have to usetscspecifically — building through a bundler that invokes TypeScipt via the API will not work. For best results, make sure this is not an incremental build (i.e. pass-fin build mode or--incremental falsefor regular compilation).For example:
tsc -p some_directory --generateTrace some_directory --incremental false -
Let's assume you called your output directory "trace". You should now have a directory structure like this:
trace
+- trace.json
+- types.json
If you compiled with build mode, it will be a little more complicated:
trace
+- legend.json
+- trace.1.json
+- trace.2.json
...
+- types.1.json
+- types.2.json
...
In this case,
legend.jsonwill tell you which tsconfig eachtraceandtypesfile corresponds to. If you don't already have a specific project of interest, you'll probably want to choose the largesttracefile and the correspondingtypesfile. For the remaining steps, we'll refer to the chosen files astrace.jsonandtypes.json, respectively.Note: In newer versions, the filename ordinals will be supplemented with a PID:
trace.9123-1.json. -
[Optional] For a quick summary of likely problems, you can use @typescript/analyze-trace:
npm install @typescript/analyze-trace
npx analyze-trace some_directory
where
some_directoryis path you passed to--generateTrace. -
Navigate to
about://tracingand clickLoad.
Navigate to and selecttrace.json. -
These trace dump files can get big, to a point where it is impossible to load them. (The tracing dump files are not statistical: all entries are included, which leads to the big outputs.) If you run into this problem, you can use the process-tracing script which can perform many useful operations on tracing files. Most importantly, the
--sampleflag can be used to mimic statistical down-sampling to any given frequency. This script has a few more useful features like auto-gzipping the result (tracing tools can load gzipped files), fixing aborted trace files, and more; use--helpto see the different options.For example:
process-tracing --sample=5 --close trace.1.json trace.1.json.gzwill downsample the trace file to a 5ms frequency, close off unterminated events (in case the tsc process crashed), and produce a gzipped file.
-
If you've never visited
about://tracingbefore, you'll see something like this:
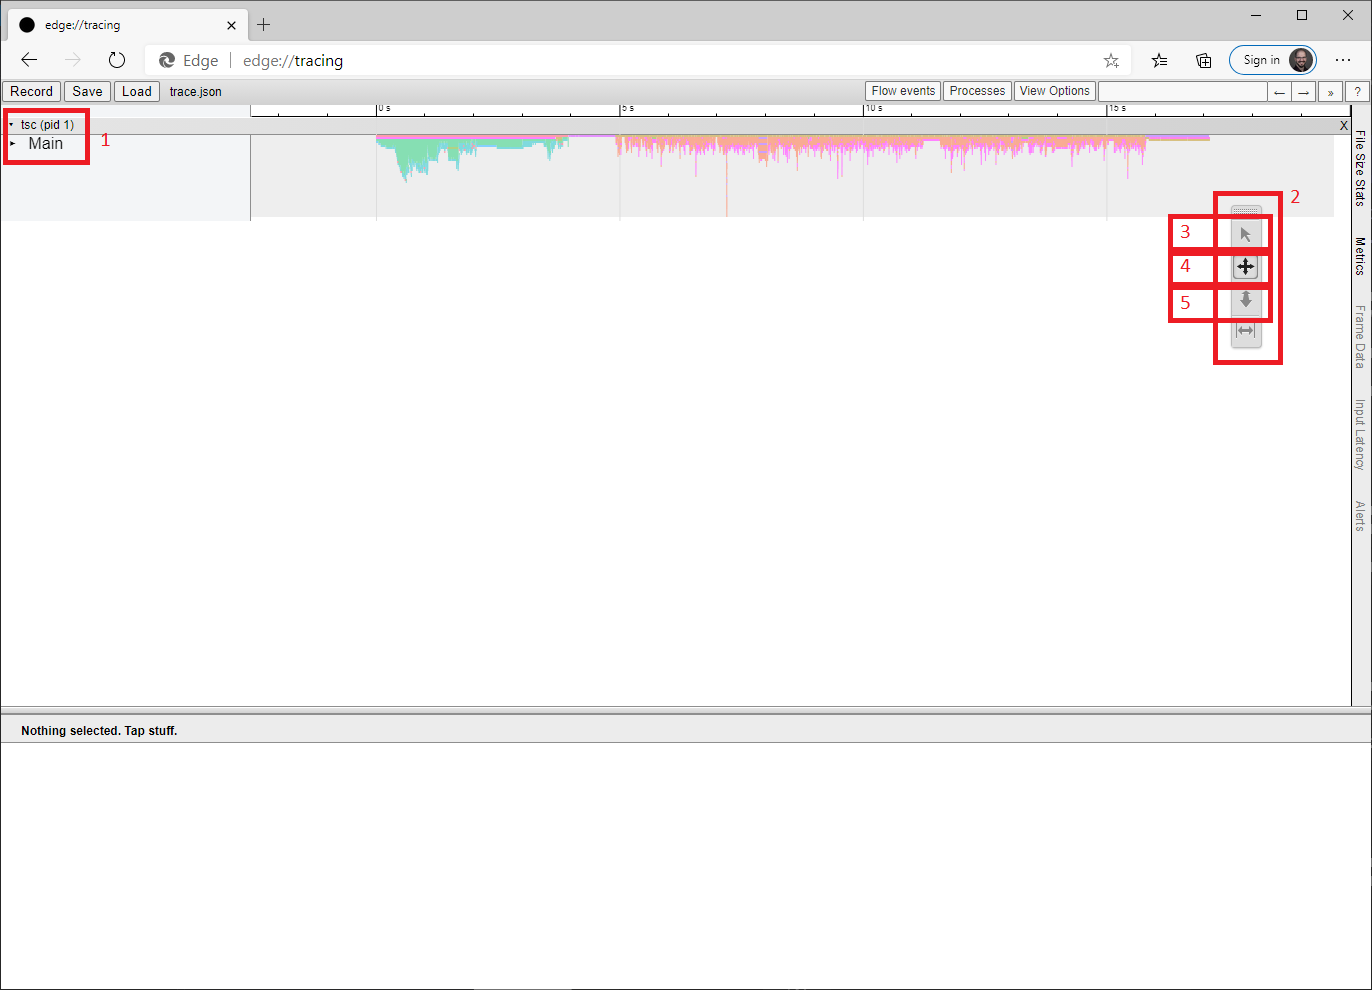
- Use the little triangle to expand the view of the "Main" thread. For convenience, we ignore all other threads.
- This little toolbar is floating — you'll probably want to move it into the blank space under the thread name (i.e. into the left sidebar). Each button indicates a cursor mode.
- This mode is for selection.
Selecting a single element is possible in most modes, but box selection is only possible in this one.
Tip: box selection is a great way to get a summary of a region. - This mode is for panning. Click-drag to scroll to other parts of the trace..
- This mode is for zooming. Click-drag up or right to zoom in and down or left to zoom out.
Aside: the
about://tracingUI is rather clumsy. An alternative is to open the trace in Devtools (F12) by clicking the Upload button on the Performance tab. This provides a more modern navigation experience, but drops instant events (mostly used for errors in compiler traces) and possibly other features. -
If you expand the Main thread and select one of the boxes, you'll see something like this, with time on the horizontal axis and (partial) call stacks growing down from the top:
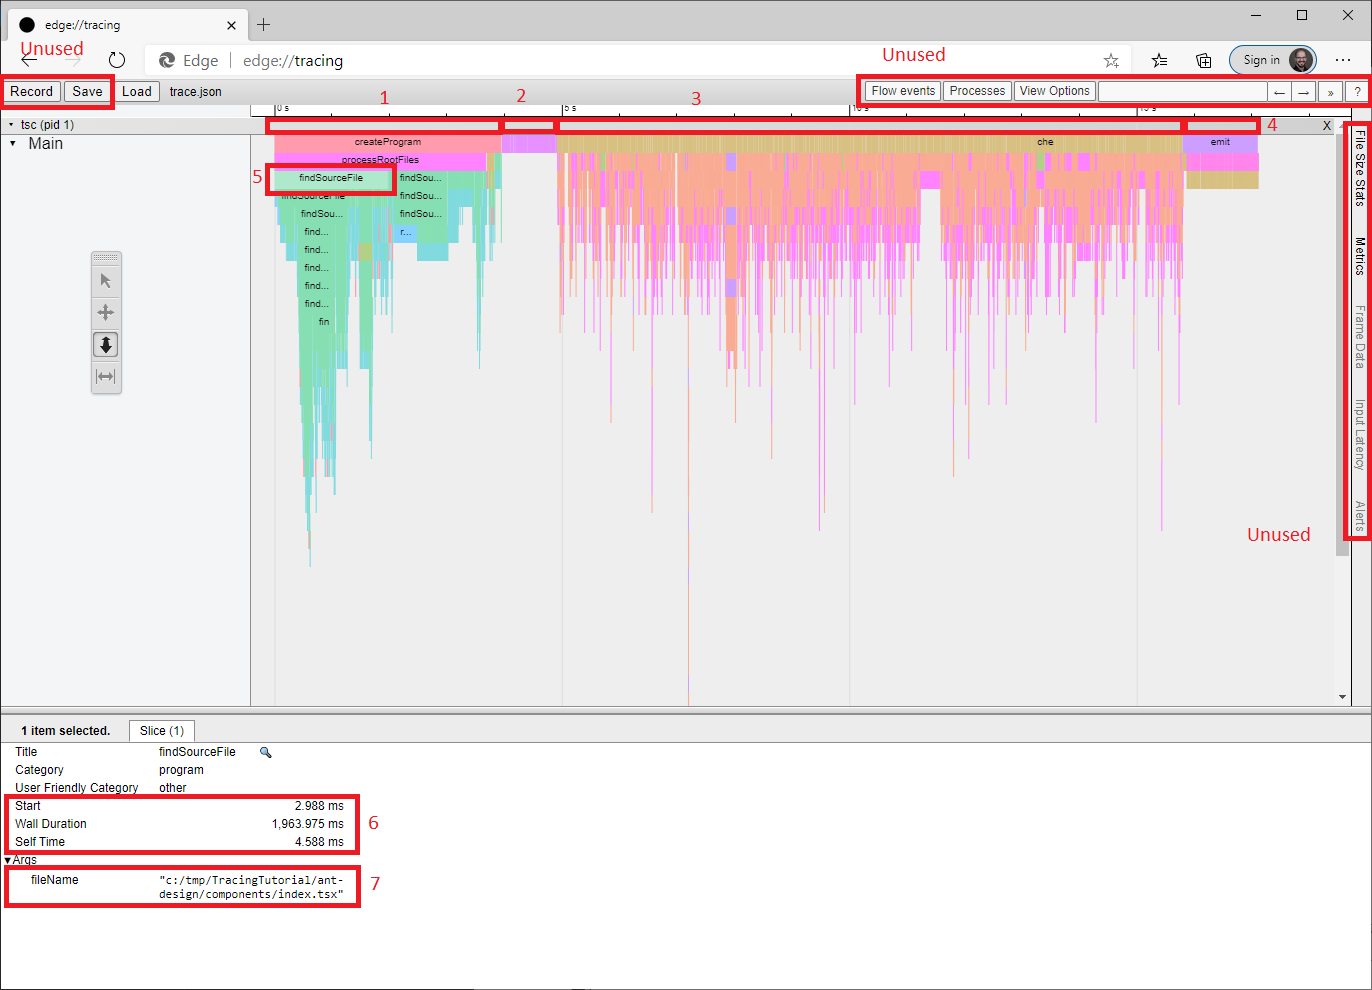
- You can easily differentiate the four major phases of compilation.
This is program construction, which includes parsing and module resolution.
Usually, you want to look for the largest
findSourceFileboxes and follow them down to see which dependency chain is taking the most time. Generally, it will be a library outside your own code. Be sure to include this library in any repro you construct. - This is the binding phase. It is rarely an issue, so we'll ignore it for now.
- This is the (type) checking phase, where most of the TypeScript-specific work happens. You generally want to start here. We'll consider this is more detail in a later step.
- This is the emit phase, which we'll ignore for now.
- This is the selected box.
- These are the built-in metadata about the box.
-
Startis the timestamp of the start of the operation — usually uninteresting. -
Wall Durationthis is what would be called "Total Time" in many profiling tools. -
Self Timeis the amount of time that is not accounted for by child boxes (i.e. directly below this one).
-
- This metadata is specific to the kind of box you're looking at. This is the most important information — it will contain paths and things.
Note: All times reflect the overhead of tracing, which is not spread uniformly through the execution. We're looking for ways to reduce the impact.
- You can easily differentiate the four major phases of compilation.
This is program construction, which includes parsing and module resolution.
Usually, you want to look for the largest
-
As mentioned above, the checking phase will generally be the most interesting when diagnosing delays. Here we see a zoomed in portion of the trace:
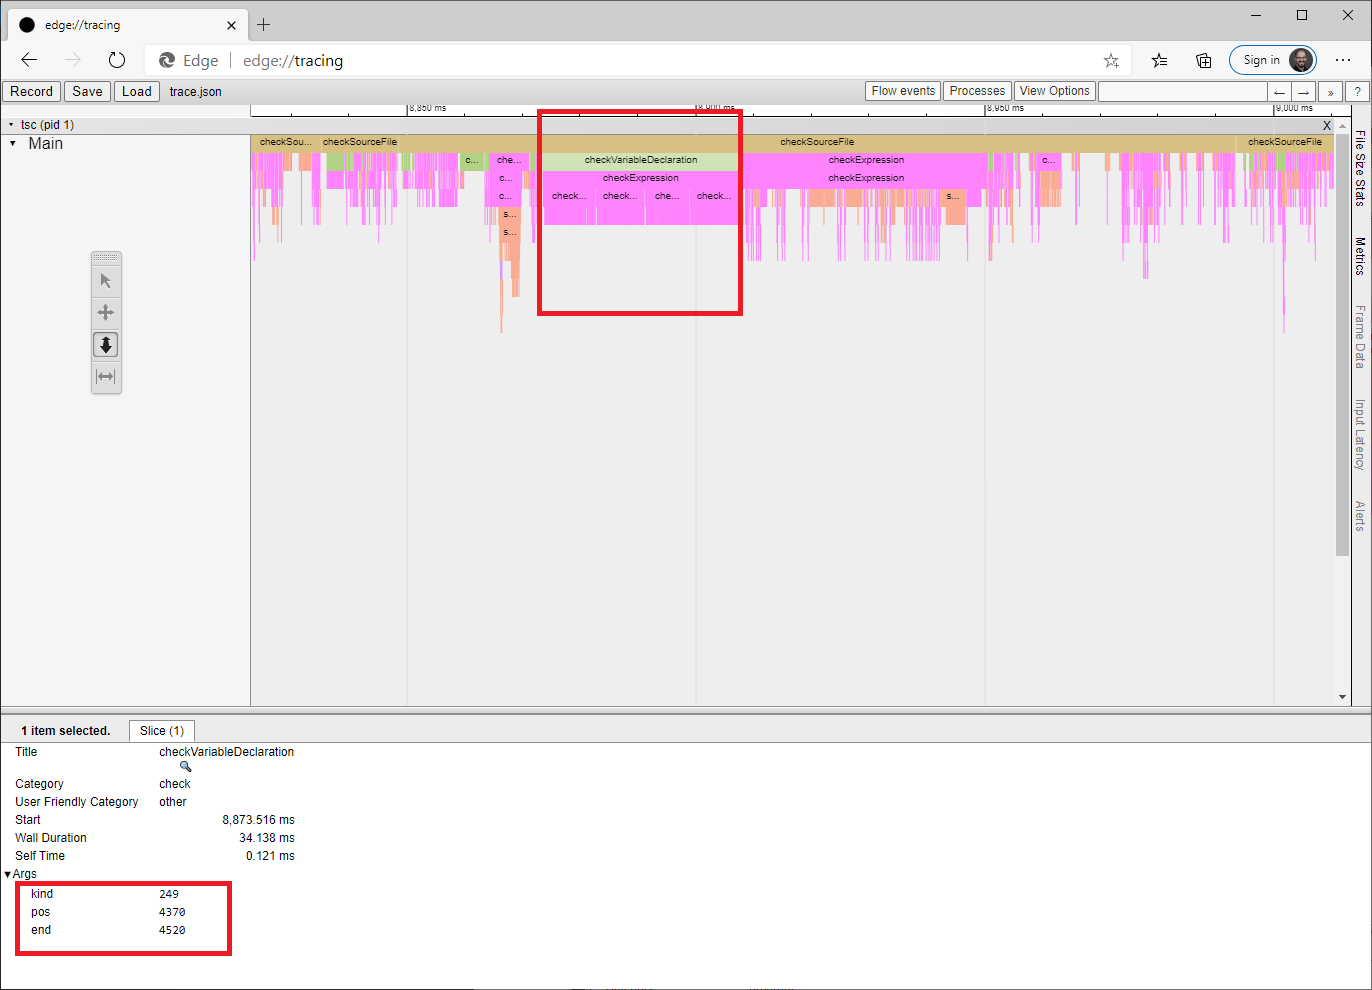
- What we're looking at is a call stack summary, with callers above and callees below.
Not all frames are present — the trace would be too large and hard to read.
Three box types are of particular interest when reducing a repro:
-
checkSourceFilegives the time spent checking a particular file. Look in the metadata for the file path. -
checkExpressiongives the time spent checking a particular expression. It will usually, but not always be in the file indicated by the containingcheckSourceFile. As of now, there is no way to tell without looking at the code and no way to recover the path if it's not the one fromcheckSourceFile. We're thinking about how to handle it. -
checkVariableDeclarationgives the time spent checking a particular variable declaration. Over the course of several investigations, we noticed that these were showing up often enough to merit their own boxes. The metadata for these boxes is not particularly convenient to consume.-
kindidentifies a member of the SyntaxKind enum. -
posis the zero-indexed character offset from the beginning of the file to the beginning of the range being checked. Note that position will be before any trivia (whitespace, comments) before the relevant code fragment, so it will frequently appear to be immediately after the preceding statement. -
endis the zero-indexed character offset from the beginning of the file to the end of the range being checked.
-
-
- In this particular screenshot, we see that a single variable declaration accounts for a large percentage of the check time of this entire file. However, the declaration itself is not interesting because its child is an expression that is nearly as wide (i.e. the declaration has low "Self Time"). This expression has four interesting sub-expressions, each of which has many, many children. So identifying those four ranges in the file would be the place to start when reducing a repro.
- What we're looking at is a call stack summary, with callers above and callees below.
Not all frames are present — the trace would be too large and hard to read.
Three box types are of particular interest when reducing a repro:
-
Once you have identified the problematic code, review [Performance] for suggestions relevant to your scenario. If none of the suggestions help, please file an issue, including code that reproduces the slowdown you're seeing and instructions for compiling it.
At this point, it's going to be pretty hard to keep going if you don't have a good mental model of how types are represented in the compiler. On top of that, the included events are likely to vary by TypeScript version. You've been warned...
To dig further on your own, you'll need to start looking at types.
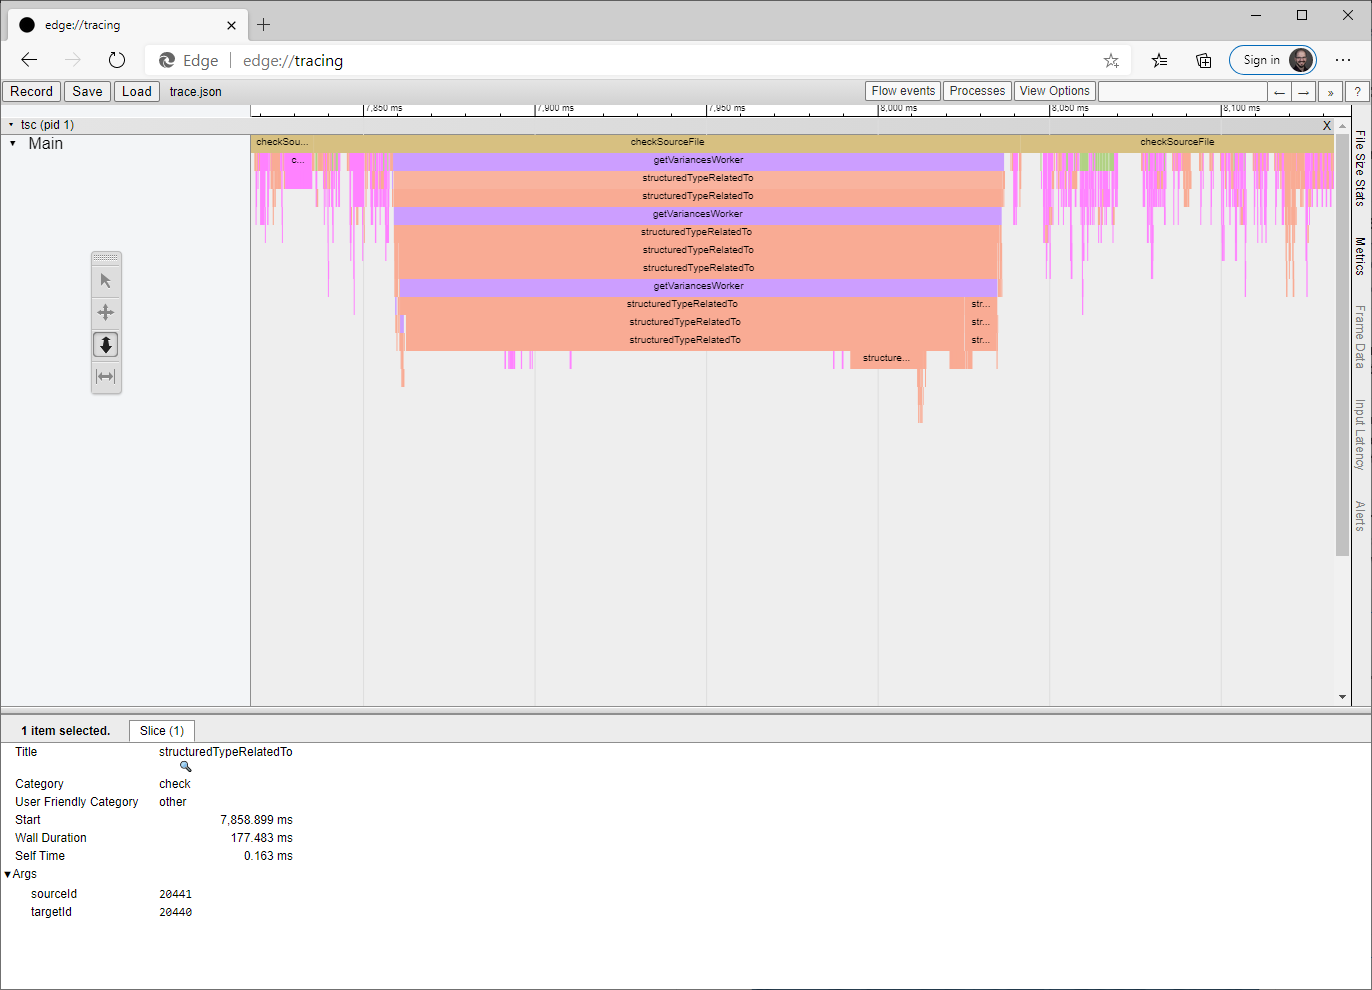
Here's a slow section with no checkExpression boxes in the (partial) stack.
Instead, it's gone straight into type checking.
To work out which code fragment triggered this work and what it's doing, you'll need to open types.json.
From the metadata, we can see that the types of interest have IDs 20441 and 20440.
Here are the corresponding entries from types.json.
(At the time of writing, the type with ID N is on line N.)
{"id":20440,"symbolName":"NamedExoticComponent","recursionId":30,"instantiatedType":146,"typeArguments":[20437],"firstDeclaration":{"path":"PROJECT_ROOT/node_modules/@types/react/index.d.ts","start":{"line":359,"character":6},"end":{"line":363,"character":6}},"flags":["524288"]},
{"id":20441,"symbolName":"NamedExoticComponent","recursionId":30,"instantiatedType":146,"typeArguments":[20434],"firstDeclaration":{"path":"PROJECT_ROOT/node_modules/@types/react/index.d.ts","start":{"line":359,"character":6},"end":{"line":363,"character":6}},"flags":["524288"]},
This data gives us some sense of what they look like and a location where we can review the declaration.
In this case, we're comparing two different instantiations of NamedExoticComponent<P> — one instantiated with type 20434 and the other with 20437.
These types are also described in types.json, so keep looking up more types recursively until you understand what's going on.
From the file path in checkSourceFile and the types we've just pulled out of types.json, we can probably guess approximately which code fragment was involved (knowing in advance that it's neither an expression, nor a variable declaration, which would have gotten a box).
Look hard enough and you'll be able to create a toy program that reproduces the performance issue you're seeing in your real code.
We'd love to hear about it but, if you still can't share, the next step is to play around with alternate declarations and any type assertions until you've sped up the toy program.
Then you can apply the same fix or mitigation to your real code.