Profiling
If you find yourself with the need to profile the extension, here's some steps you can take to get a usable profile:
- npm install -g vsce <- This is the vscode extension packager. It needs to be global
- npm run package <- This will generate a vsix of your development bits
- Close VS code
- Navigate to your user/.vscode/extensions directory
- Delete all ms-python directories there.
- Open VS Code and run the 'Install From VSIX' command to install the vsix you just generated.
This gets your bits (and only your bits) installed as a package inside of VS Code without having to run the debugger.
The next step is to make those bits non-minified.
- npm run clean <- This will clean your output directory
- npm run compile
- npm run compile-webviews
- Copy the 'out' directory from your source code overtop of the 'out' directory in your user/.vscode/extensions/ms-python directory
- Copy the 'node_modules' directory from your source next to the 'out' directory in your user/.vscode/extensions/ms-python directory. This might take a while.
Now you have debug bits installed.
Follow the directions here: https://github.com/Microsoft/vscode/wiki/Performance-Issues#profile-the-running-extensions
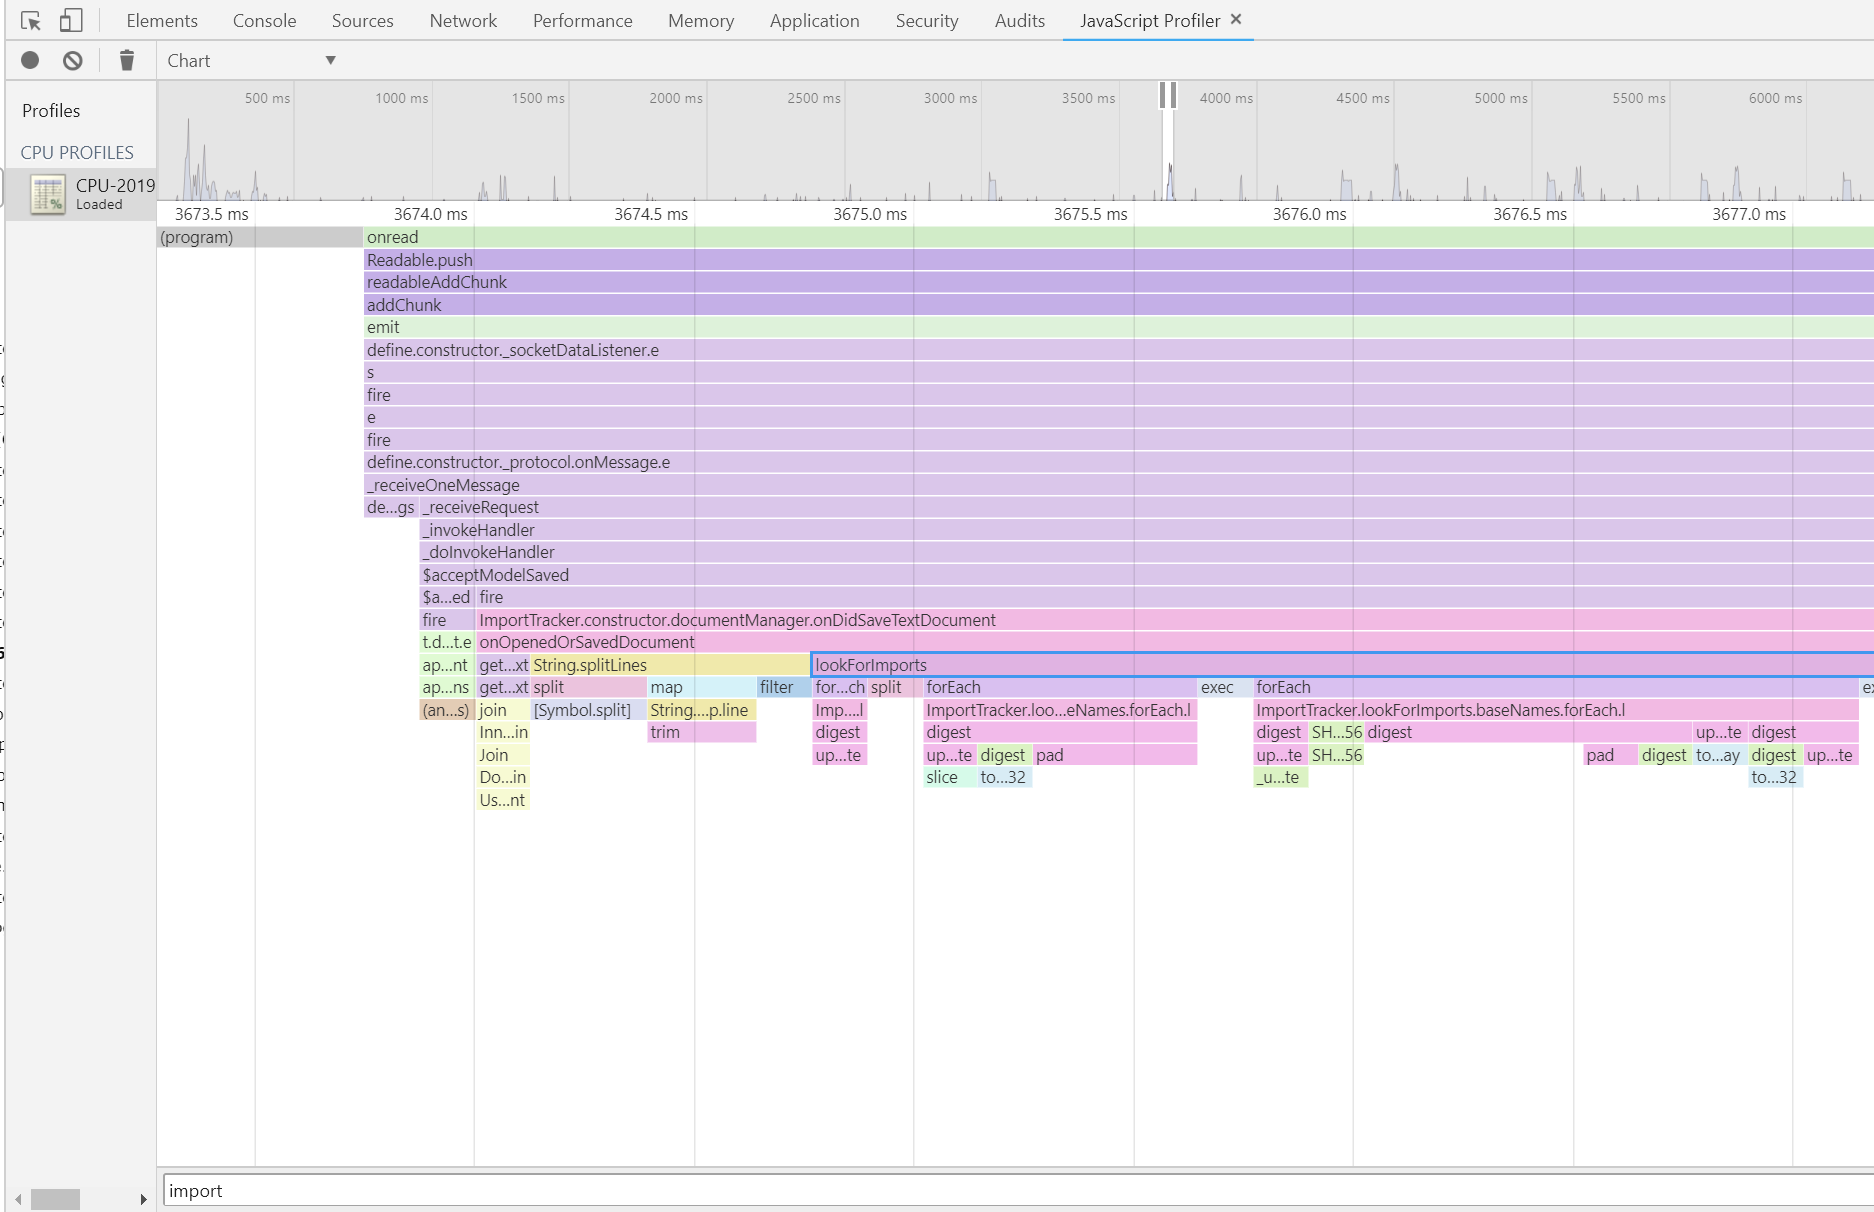
You should generate a profile and save it. You can then load it into any Chrome javscript profiler and look at the results.
I found using the 'Chart' view and searching (CTRL+F) for classes/functions I thought might be expensive was a good way to start:
- Get the
.cpuprofilefile from the user. They can get that file by following this instructions. - Get the extension version the user used, either from the VS Code marketplace, Azure, or build it yourself.
- Open the
.cpuprofilefile in the Edge devtools or directly on VS Code to find an identifiable function that we can find on a minimized js file.
These profilers help find the slow functions, which file they're in, and which line. In this case, the slow function is l and gets called by t.getDependencies, both on extension.js and on line 47.


Also, open it on notepad since neither Edge nor VS Code display the column the function is at. In this case, the l function is on column 256673.

- Use this tool to find the file and function that causes the performance issue. Open a terminal in the folder where the .js and the .js.map file are located, and run
source-map resolve <path>.js.map <line> <column>. In this case, the file in the project with the slow function isplanner.js, and the function isdependencies.forEach(...).

Based on the instructions here, you can also use chrome to profile the mocha tests: https://medium.com/@paul_irish/debugging-node-js-nightlies-with-chrome-devtools-7c4a1b95ae27
Essentially I did this:
- Open chrome://inspect in chrome
- Run
node .\node_modules\mocha\bin\mocha --inspect-brk --require source-map-support/register --opts ./build/.mocha.functional.opts "--grep=Simple text" - In the chrome inspector, wait for the node process to show up
- Click the 'Open Dedicated DevTools for Node'
- Debug breakpoint on entry should hit
- Switch to profiler and start profiling
- Once done the profile can be inspected in that window or saved and opened in another chrome window.