This will detail, based on your historical Throughput (completed backlog items/user stories), the likely completion date of Epics (if using Jira) or Features (if using Azure DevOps) based on the number of child items and a forecasted target date, as well as accounting for Epic/Feature work in progress.
Forward planning for a given period (e.g. a quarter) and projecting the likely completion of work. Managing expectations around delivery and better understanding of the impact the amount of things you are working on at any given time (WIP) has on your Feature delivery.
Use this when trying to understand what Epics/Features you are likely to deliver and when they will be delivered, ideally viewing this on a regular (weekly) basis
- Make sure you have the latest version of Power BI Desktop
- Download the appropriate template file:
- If you are setting this up for Jira then follow these steps to setup a Jira API token and note it down (e.g. copy/paste into Notepad)
- If you are setting this up for Azure DevOps then follow these steps to setup a Personal Access Token (PAT) with full access and note it down (e.g. copy/paste into Notepad)
- Then you're good to get started!
-
Open the relevant .pbit file in Power BI Desktop
-
For Jira:
- Add your Jira URL
- Add your Jira Project Key
-
For Azure DevOps:
- Select http/https (only choose http if your Azure DevOps Server is HTTP)
- Add the Analytics / Azure DevOps Server URL - for Azure DevOps services enter 'analytics.dev.azure.com' / for Azure DevOps Server enter your server details
- Add your Organization / Project / Team Name
-
It should then look something like this (for Jira):

-
Or this (for Azure DevOps):

-
Hit 'Load'
-
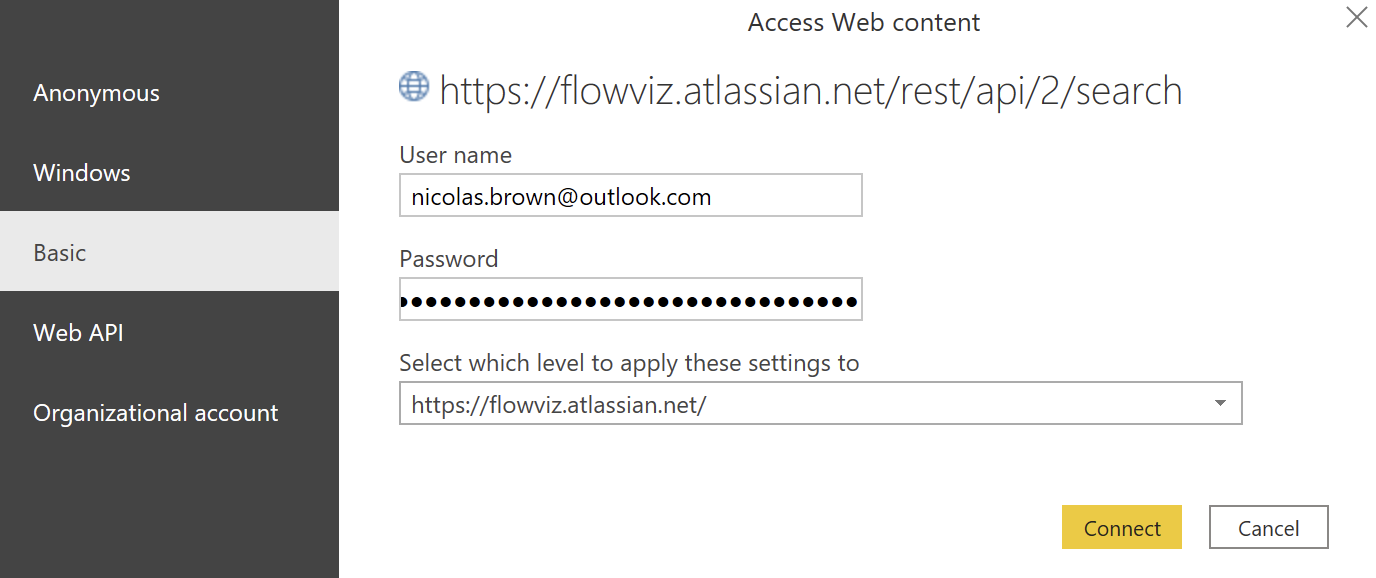
You will be prompted for a login
-
For Jira, choose Basic and enter:
- Your email associated with your Jira account for your username
- Your API token you created in the Prerequisities
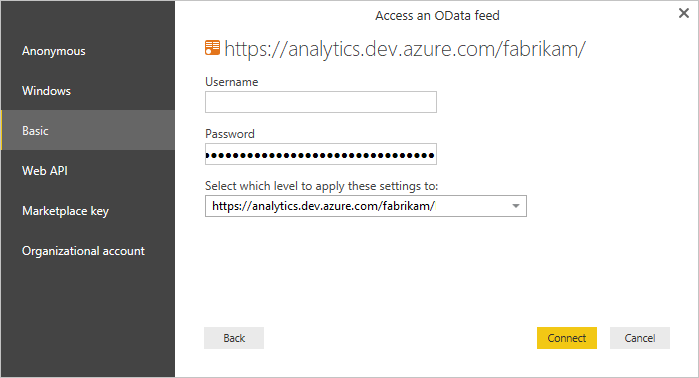
- For Azure DevOps, choose Basic and enter:
- Your Personal Access Token (PAT) to login, entering it in the password field (user can be left as blank - make sure it has 'Read' access to Analytics)
- Then hit 'Connect' and wait for the data and charts to load!
This template is built and maintained by Nicolas Brown use the issues section for any bugs you find and the discussion section for any question, ideas and/or feature requests.