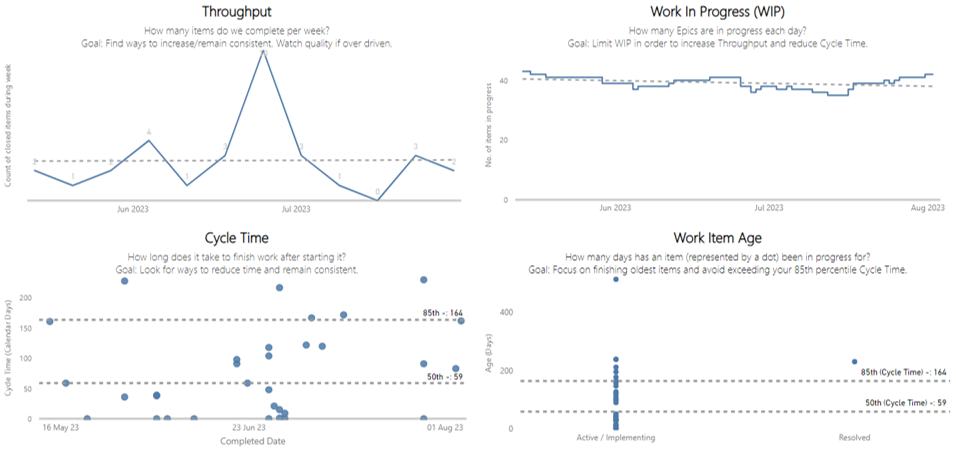
This report will visualize the four flow metrics of Throughput, Cycle Time, Work In Progress and Work Item Age for Feature or Epic work item types
Managing the flow of work is not something limited to just teams. Flow should be proactively managed on a regular cadence at all levels (Story/Feature/Epic) of work.
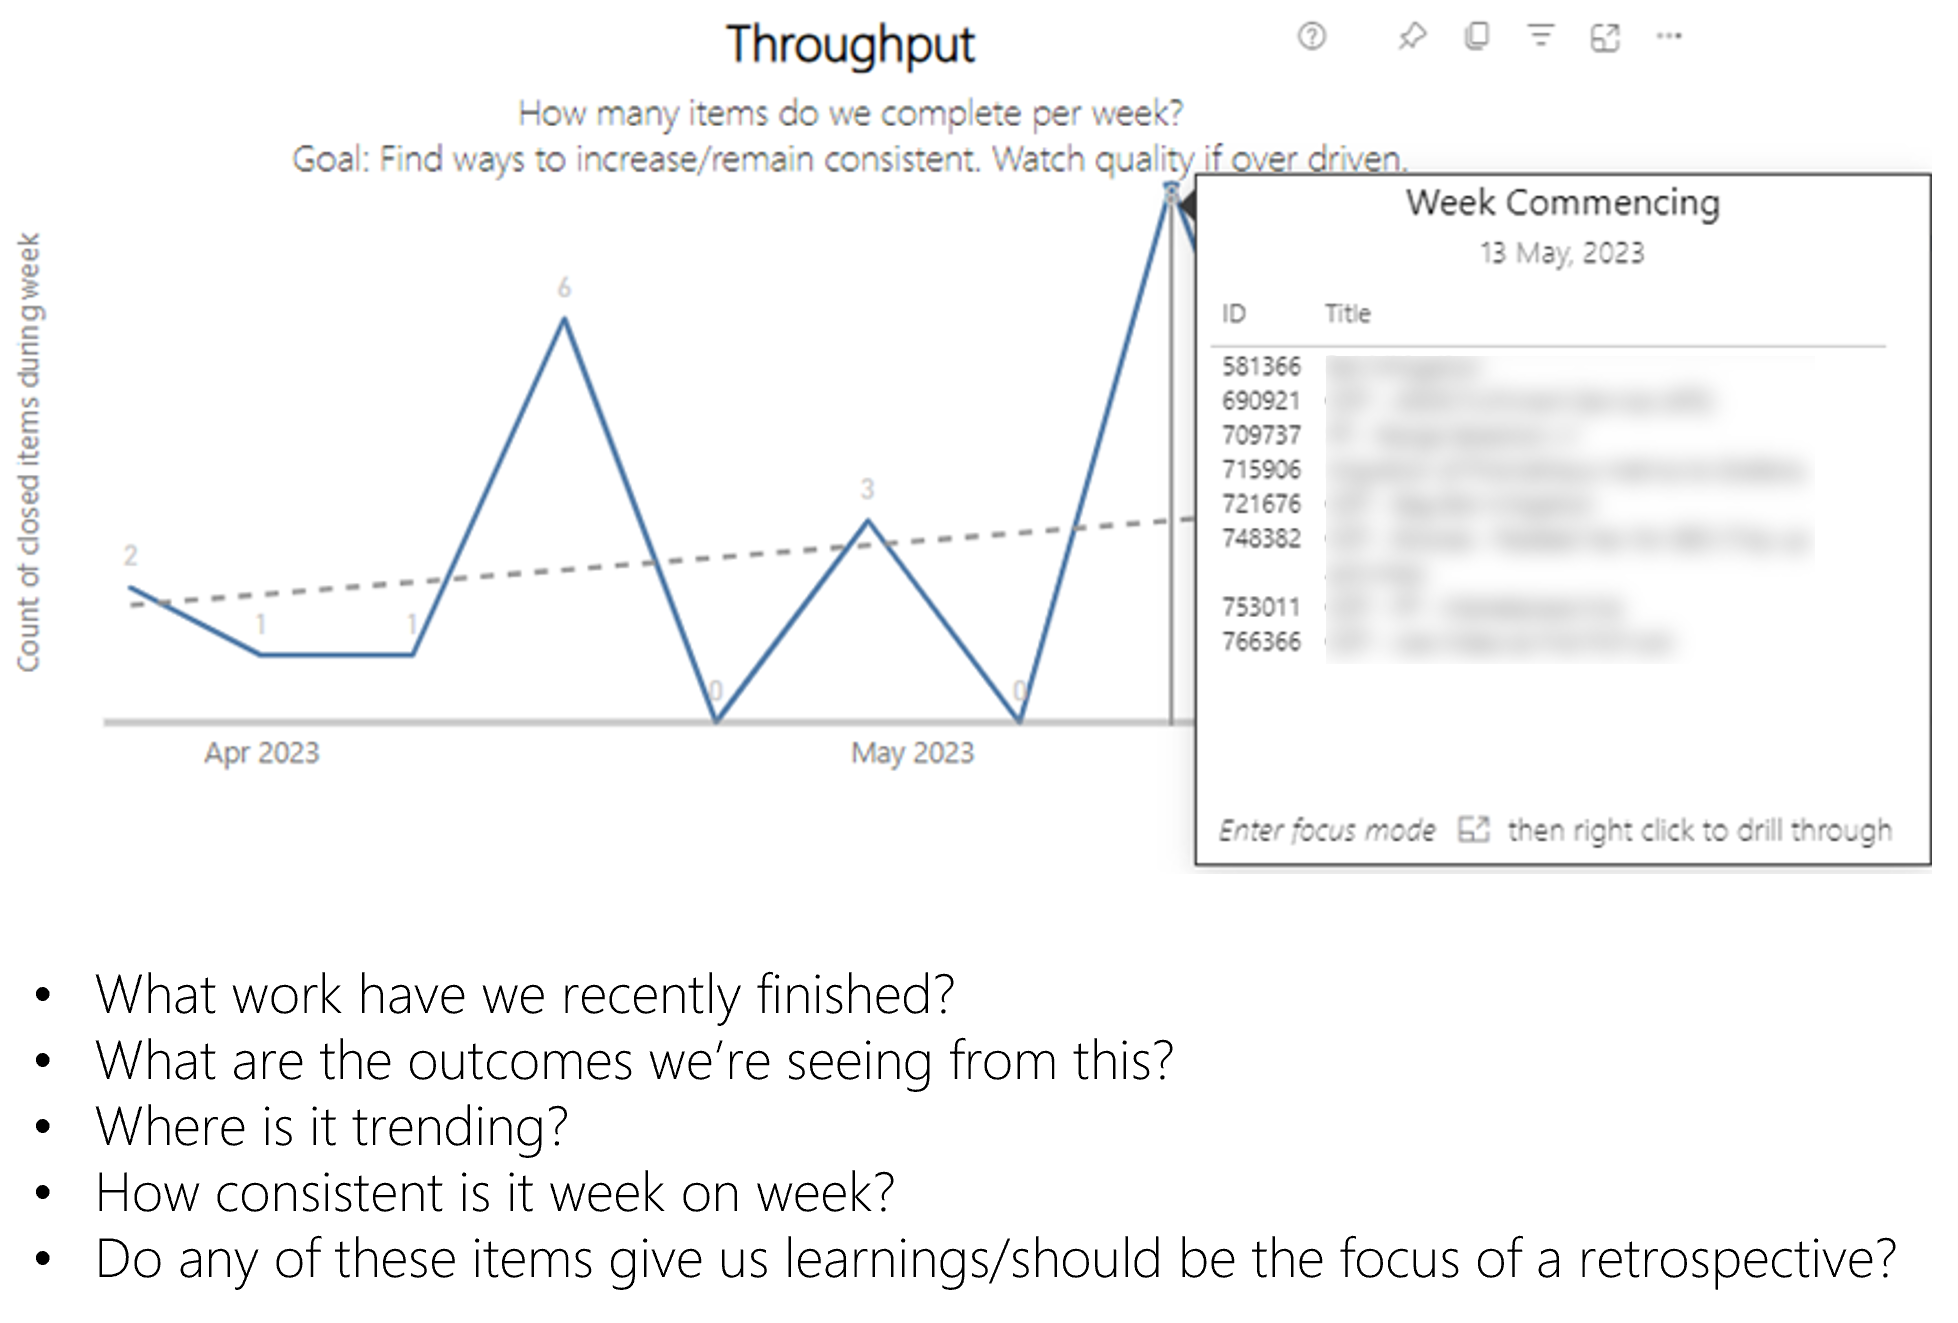
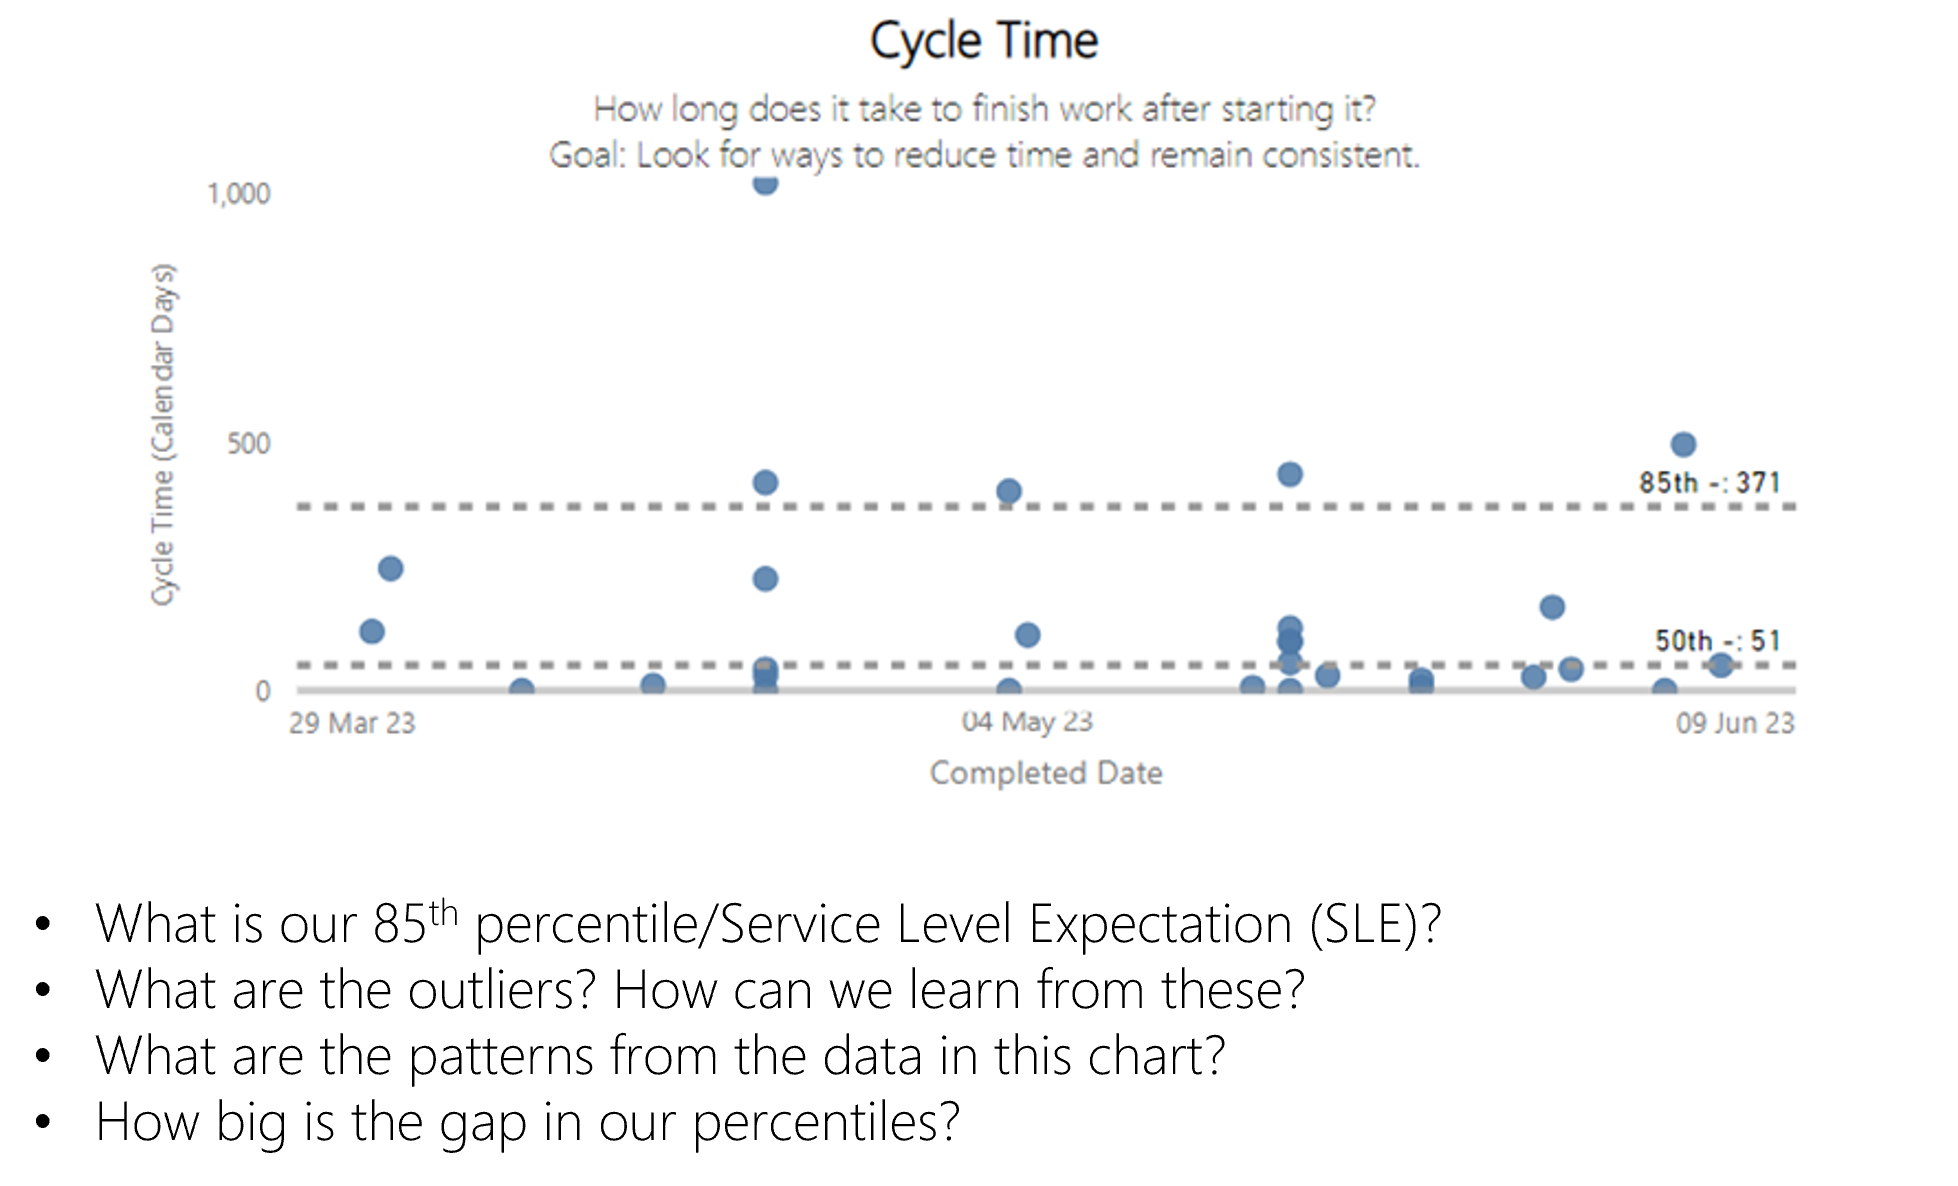
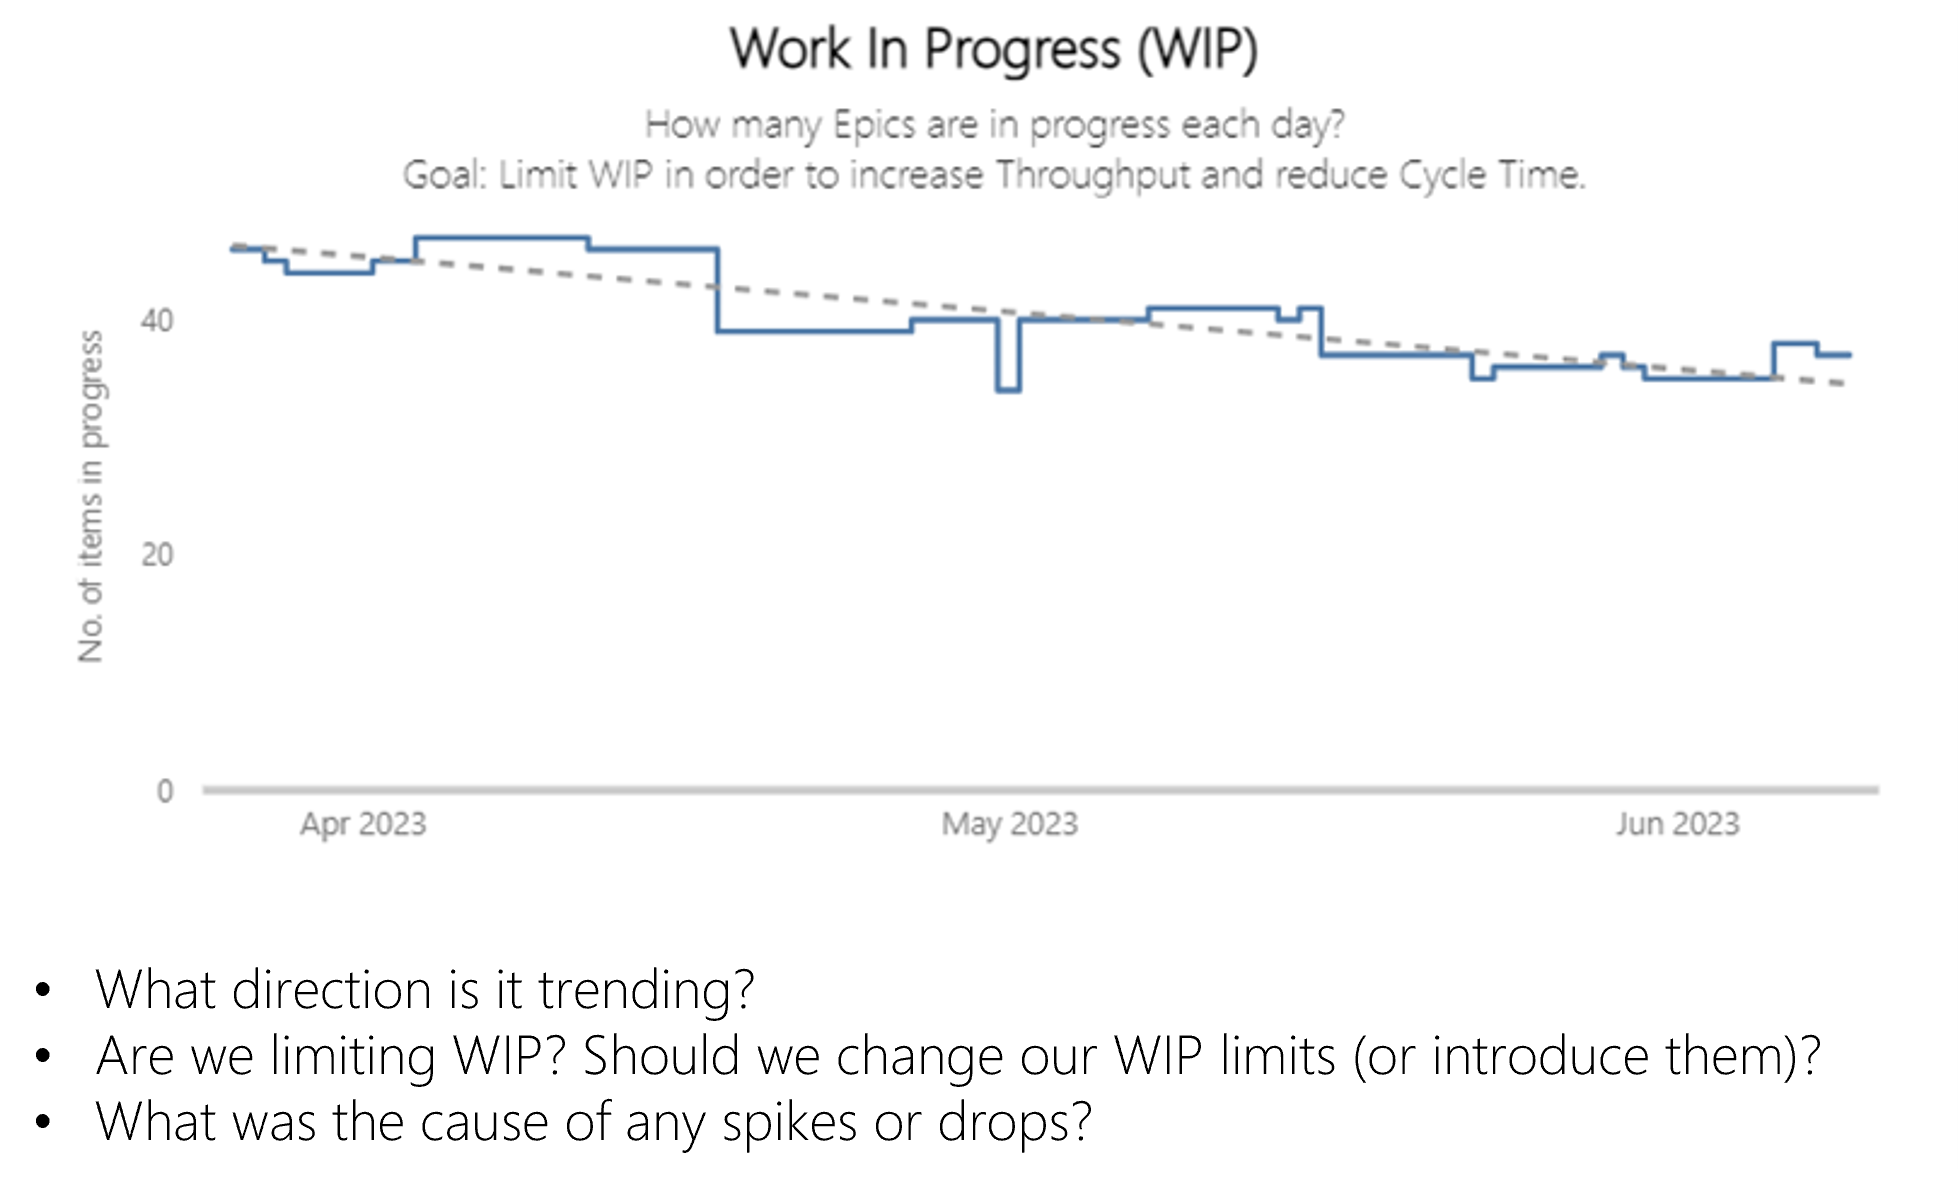
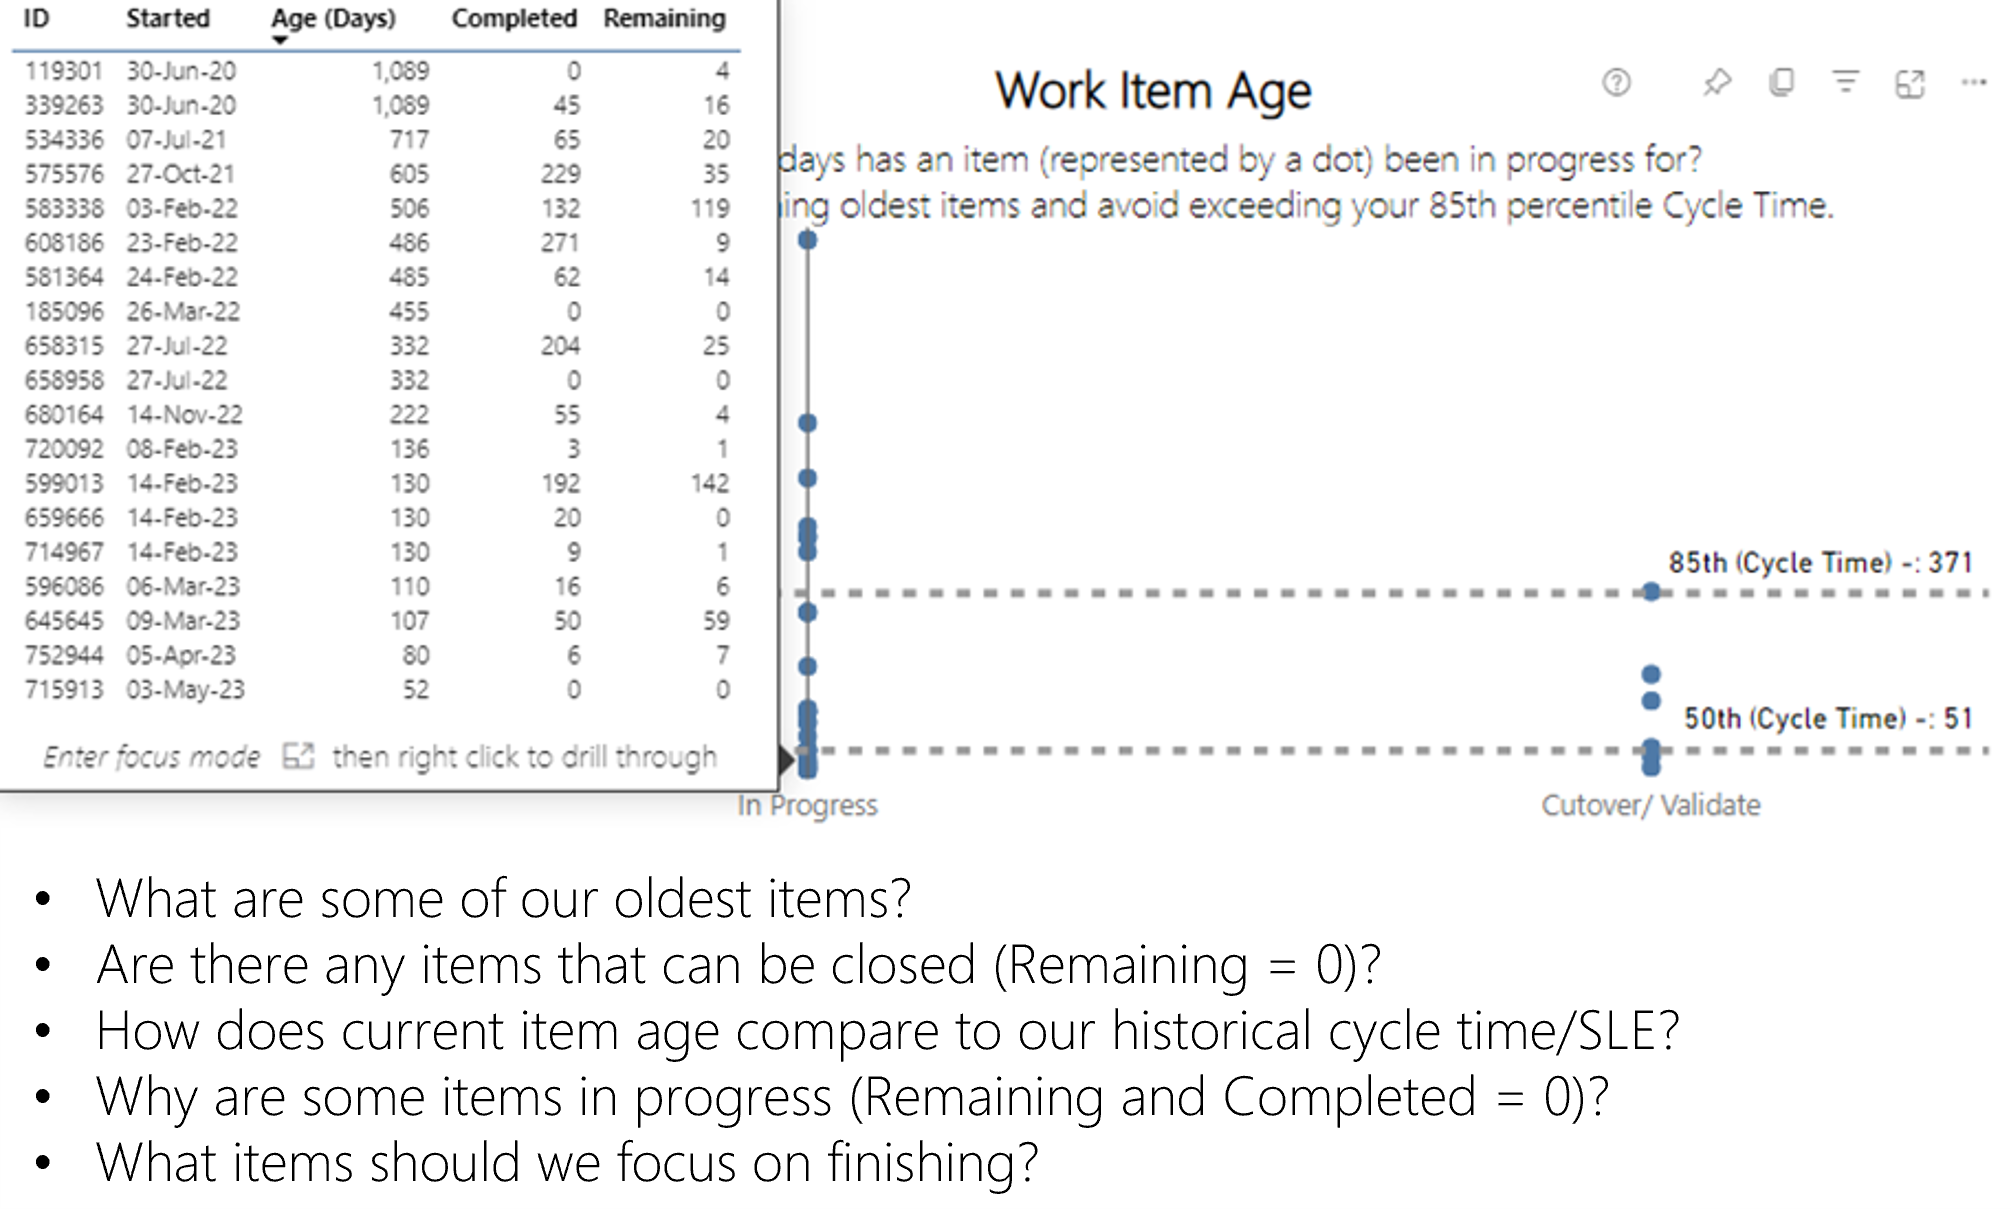
Use this at least weekly to understand the ‘flow’ of work items at Epic or Feature level. Use it to look at what has recently finished, how long those items took, if there is anything to learn from those and if we are seeing the projected value from them. Similarly use it to look at what is in flight right now - if you are limiting work in progress, what items have been in progress the longest and what should you be focusing your attention on finishing.
- Make sure you have the latest version of Power BI Desktop
- Download the appropriate template file:
- If you are setting this up for Jira then follow these steps to setup a Jira API token and note it down (e.g. copy/paste into Notepad)
- If you are setting this up for Azure DevOps then follow these steps to setup a Personal Access Token (PAT) with full access and note it down (e.g. copy/paste into Notepad)
- Then you're good to get started!
-
Open the relevant .pbit file in Power BI Desktop
-
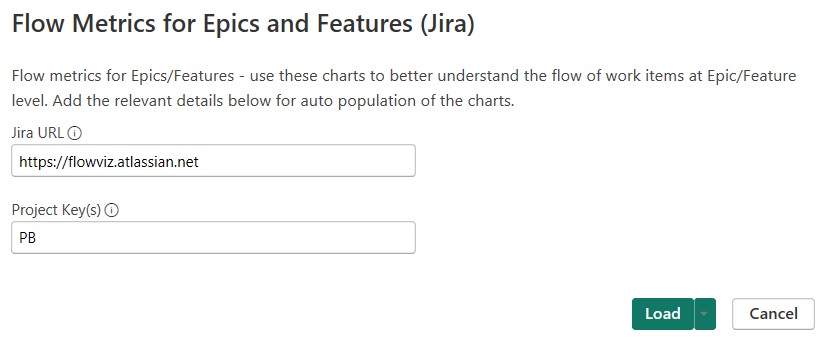
For Jira:
- Add your Jira URL
- Add your Jira Project Key(s)
-
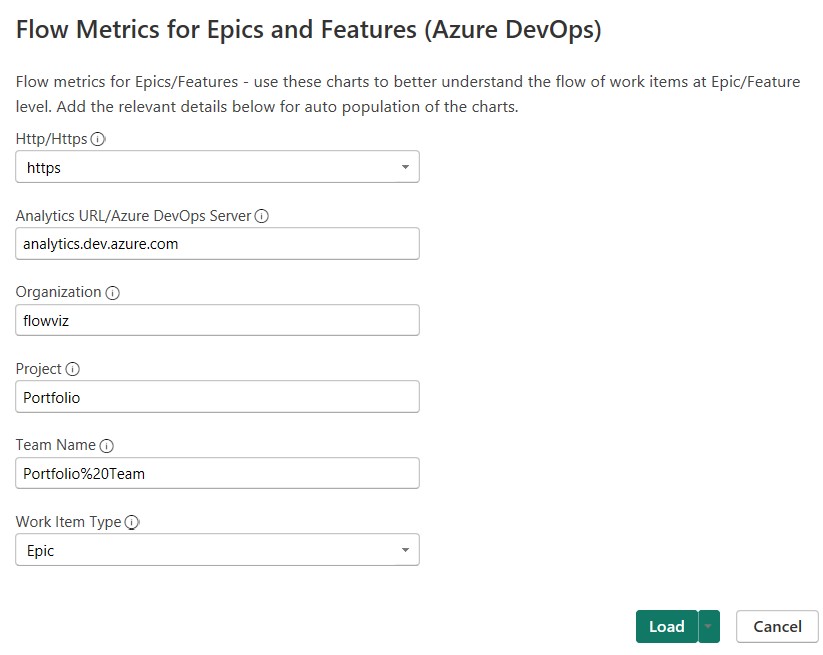
For Azure DevOps:
- Select http/https (only choose http if your Azure DevOps Server is HTTP)
- Add the Analytics / Azure DevOps Server URL - for Azure DevOps services enter 'analytics.dev.azure.com' / for Azure DevOps Server enter your server details
- Add your organization / project name / team name
- Select 'Epic' or 'Feature' depending on what work item type you want to do this for
-
It should then look something like this (for Jira):
-
Or this (for Azure DevOps):
-
Hit 'Load'
-
You will be prompted for a login
-
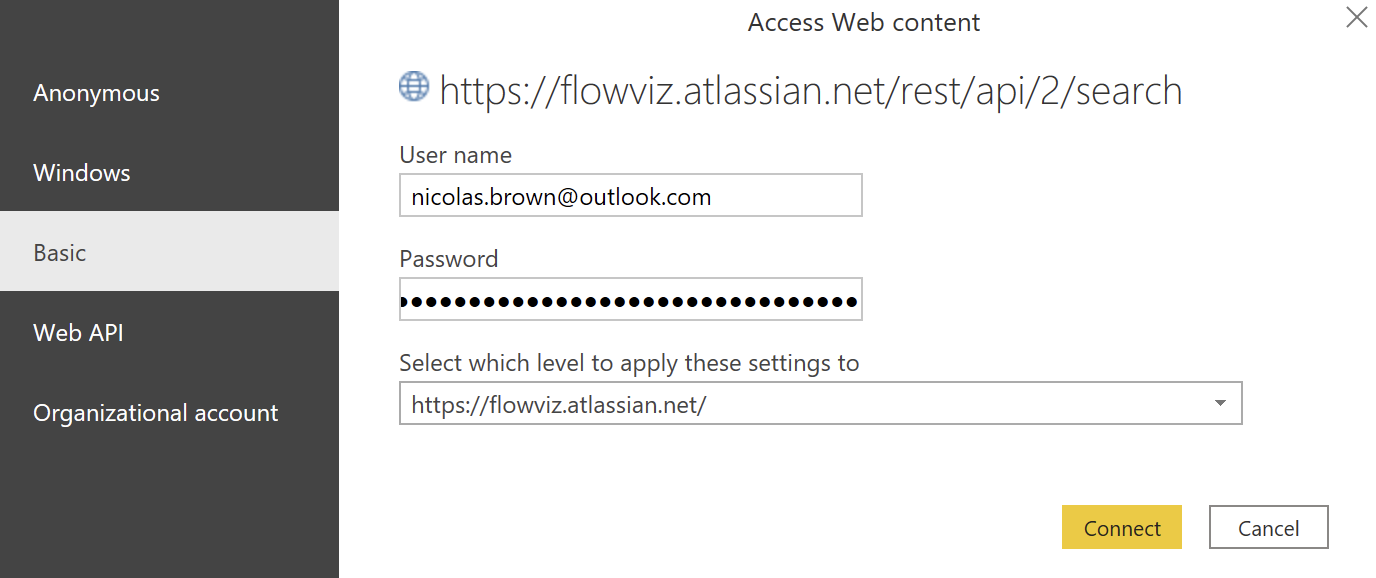
For Jira, choose Basic and enter:
- Your email associated with your Jira account for your username
- Your API token you created in the Prerequisities
- For Azure DevOps, choose Basic and enter:
- Your Personal Access Token (PAT) to login, entering it in the password field (user can be left as blank - make sure it has 'Read' access to Analytics)
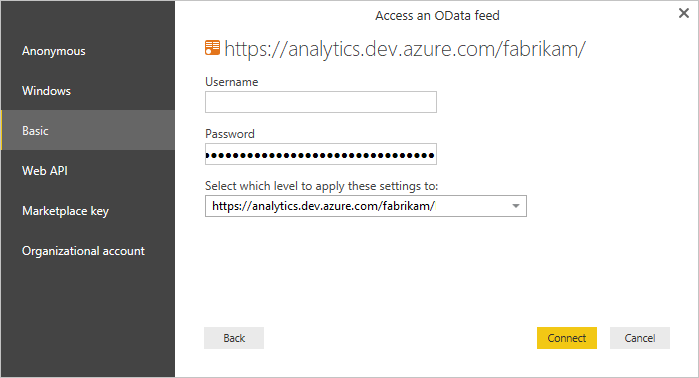
- Then hit 'Connect' and wait for the data and charts to load!
This template is built and maintained by Nicolas Brown use the issues section for any bugs you find and the discussion section for any question, ideas and/or feature requests.