See the wiki for more info
Spiderweb lets you
- make posts
- add those posts to graphs
- link the posts together
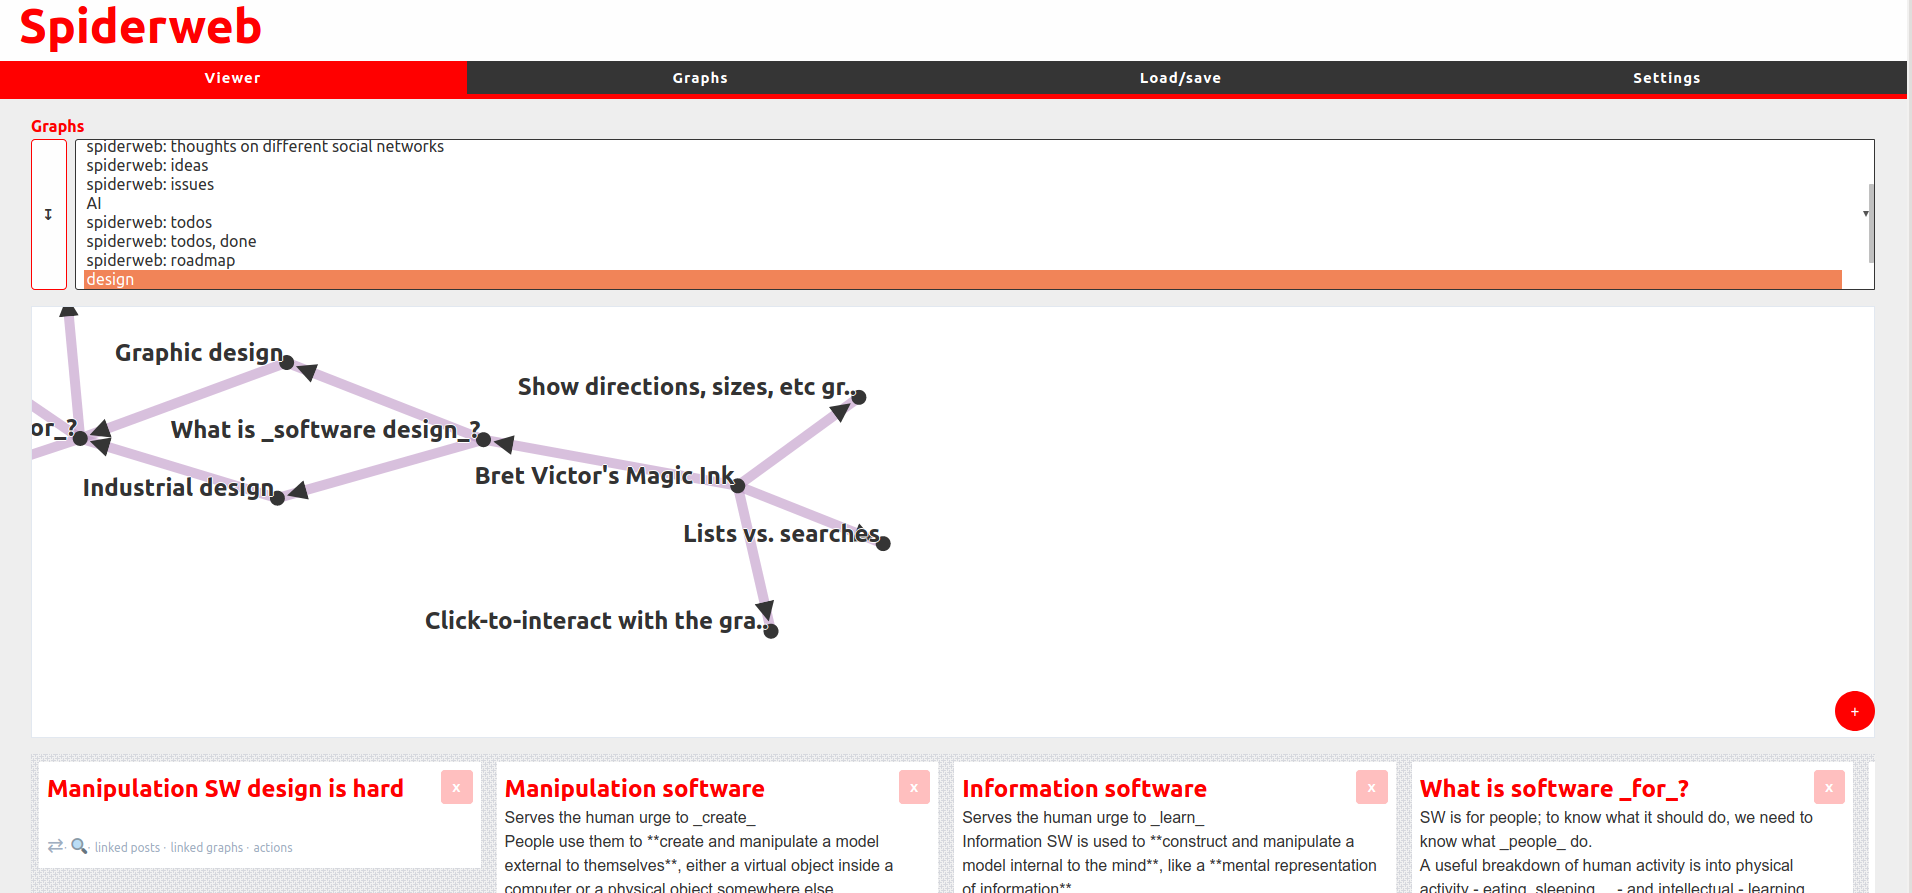
- view the graphs of posts you've made - you can look at more than one graph at a time
It's completely offline, and doesn't many any HTTP requests at all - though you can optionally choose to backup your data to a Firebase Realtime Database if you want, with your own API keys
I'm mainly making Spiderweb for myself, but I'll happily take feature requests.
Download a release, then unzip it, and open index.html in a browser.
When you start Spiderweb for the first time, you'll only have 1 graph, the default one. You'll want to add posts to it by clicking the little red circle in the bottom-right, then press Add post - you can choose whether or not you want it to attached to one (or more) of your graphs.
If you don't attach it to a graph straightaway, later on you can click the red circle again and press Attach posts to graphs - the same post can be in multiple graphs.
When you have more than one post in a graph, you can link them together with "Add link between posts". You can also change or remove a link in the bottom-right menu too.
You can make a new graph and change or remove any existing one (any posts that were atached to it won't be removed) in the Graphs tab.
The Load/save tab lets you import and export your data and settings.
Inside the Settings tab you can choose
- whether you want your data to be saved automatically
- if your data should be backed up to a Firebase Realtime Database (with your own API keys)
etc.
Posts, links and graphs are all kinda independent:
- You can make a post by itself, without linking it to another one, or adding it to a graph.
- You can add a post to a graph without linking it to another post
- After you've made a post, you can link to many others - you don't need to link the post while you create it
- Deleting a link doesn't delete either the source or the target post
- Deleting a graph doesn't delete the posts in it, only the links - you can add the posts to another graph
I haven't made it yet, but you can host a release wherever you want yourself.
To work on the offline version:
- You need Node (NVM is good for this) and Gulp, then
git clone git@github.com:nd9600/spiderweb.git && cd spiderwebnpm install && gulp && npm run dev- Copy the
assetsfolder frompublic/intodist/ - Then you can open
dist/index.htmland it should load - you might need to change the URLs to the stylesheets & the JS files in the<script>s at the bottom to get it to work
To work on the online version:
- Install PHP, Node (NVM is good for this) and Gulp, Composer, for PHP package management, and MySQL for your system (be sure to include any PHP extensions Composer needs, like
php-mysqlorphp-mbstring) git clone git@github.com:nd9600/spiderweb.git && cd spiderwebcomposer installnpm install && gulp && npm run devphp artisan serve, then it'll be available onlocalhost:8000
If you find any more bugs, I'd appreciate it if you made an issue.
Focusing on a post (by pressing the little magnifying glass) works perfectly fine on a desktop, and on a phone in portrait, but on a phone in landscape (on my phone, at least), it zooms the graph over to a position where the post is almost visible, but not quite.
I'm not sure how to fix this; the way I see the <svg> element that holds the graph works, on a desktop it's full-size, showing everything it's supposed to. On a phone, it "clips" the SVG like a little window over the whole thing, so you can only see a small bit of it at a time.
I've made the focusing center the graph so that it looks good on a desktop and on a portrait phone, but I don't think I can get it to also show the post on a landscape phone at the same time.
(imagine a little portrait phone over the top-left corner of the graph, and a landscape one; it's hard to get them to overlap and show the same bit of the graph in a way that you can actually see a post's full title)
If you change the graphs (e.g. add or remove a subgraph) when you're not on the "Viewer" tab, sometimes it won't update the graph - you just need to refresh the page, or change the data while you're on the tab (by panning around the graph or something like that), then it'll be updated.
This is because the actual data gets changed, and D3 immediately tries to re-render the graph, but it can't, because it's not visible and not in the DOM yet, so it can't re-render, but it doesn't try to re-render when you do go back to the tab.
This is also an issue when you change the post-width and go to the Viewer tab again, the "number of posts that are visible" indicators won't update until you scroll again.
You can force the graph to re-render manually, by pressing the little "⟳" button in the top-left of the screen
Questions that would probably be frequently asked if I had users
I've made Spiderweb for myself, so right now it only does what I want or need it to do. If you'd like it to do something else, just shoot me an issue.
Either
- I don't want it to do that
- I do want it to, but I can't be bothered making it or it's too hard