Restore prefetching for GC marking #11827
Conversation
|
Could we also see the result of trunk on your micro-benchmark? (It's an optimization on top of the current runtime, so I would be curious to know how much it actually optimizes the current runtime.) (cc @gadmm who is interested in prefreching) |
There was a problem hiding this comment.
One obvious change in the PR compared to the same logic in mark_slice_darken is that mark_slice_darken does something careful and complex with Lazy/Forcing tags to account for concurrent update from a mutator forcing the thunk:
Lines 714 to 725 in e6340ce
Your PR on the other hand does nothing of the sort, it handles Lazy/Forcing blocks like any other.
Can you explain why the Lazy/Forcing logic is not necessary anymore, or maybe was not needed in the first place?
Sure, I added the result to the benchmark with the parent commit (
Yes, indeed, that's something I forgot to mention: we dropped the lazy/forcing optimization to simplify the prefetching code as the performance gain may not be obvious. |
Was it really an optimization, or was it there for correctness? The trunk code seems to be designed to avoid the issue where a concurrent update to the block tag (from Lazy to Forcing, or from Forcing to Forward) would "reset" the mark bits from MARKED to UNMARKED. Now with the PR code, I suppose that this could happen. () Would it be unsafe if it happened, for example, could it result in the value being collected? (For reference, the concurrent tag update would come from this code: Lines 198 to 217 in e6340ce ) |
You actually may be very right; this doesn't seem to be an optimization! While trying to fix this, I went back to using an attempt to refactor the code to avoid code duplication that I deemed invalid and hurting performance. But performance only drops a little. New benchmark results: |
|
I also updated results for the 4.14 benchmark as the comparison wasn't fair: the compiler wasn't compiled with |
|
Gabriel Scherer (2022/12/21 06:50 -0800):
@gasche commented on this pull request.
> +Caml_inline bool pb_full(const prefetch_buffer_t *pb)
+{
+ return pb->enqueued == (pb->dequeued + PREFETCH_BUFFER_SIZE);
+}
+
+Caml_inline uintnat pb_size(const prefetch_buffer_t *pb)
+{
+ return pb->enqueued - pb->dequeued;
+}
+
+Caml_inline bool pb_above_waterline(const prefetch_buffer_t *pb)
+{
+ return ((pb->enqueued - pb->dequeued) > pb->waterline);
+}
+
+Caml_inline void pb_drain(prefetch_buffer_t *pb)
I read `pb_fill` and `pb_drain` as actions, just like `pb_push` and
`pb_pop`. I wonder if `pb_fill_mode` and `pb_drain_mode` would be
clearer -- we are not draining or filling the queue, we are changing
its mode to drain or fill over time.
Uninformed suggestion. If things are what you describe, wouldn't it be
even clearer to have a `queue_state` variable and to define an enum with
the possible values with meaningful names, e.g. `FILL_MODE` and
`DRAIN_MODE` ?
|
Ideally, probably yes. But this is performance sensitive code and this would involve one more branch (to test the mode first and then the number of elements against the waterline). |
|
Fabrice (2022/12/21 08:14 -0800):
Ideally, probably yes. But this is performance sensitive code and this
would involve one more branch (to test the mode first and then the
number of elements against the waterline).
Okay, too bad. I thought it was jsut a matter of replacing an integer
variable with a variable with a slightly richer type so I didn't expect
the proposal to involve additional tests. But many thanks for having
taken it into account.
|
There was a problem hiding this comment.
This looks good @fabbing and I think the implementation matches your description.
One question, do you have some sandmark suite (macro) benchmarking results for runtime and latency? I'm interested in the latter because the Chunk_size has increased significantly.
|
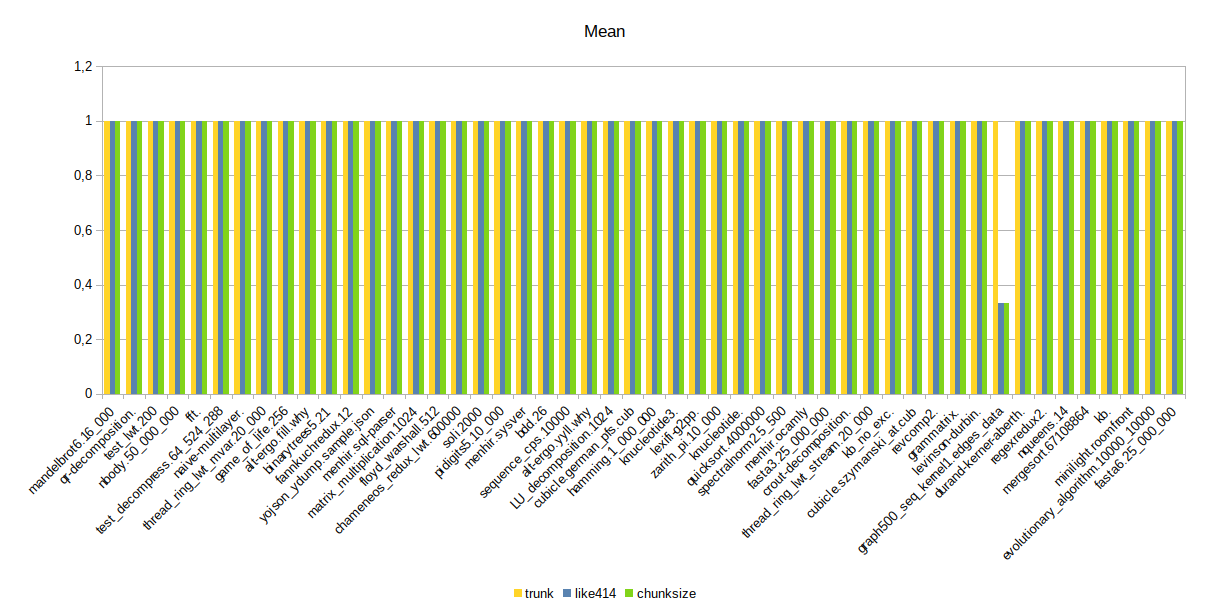
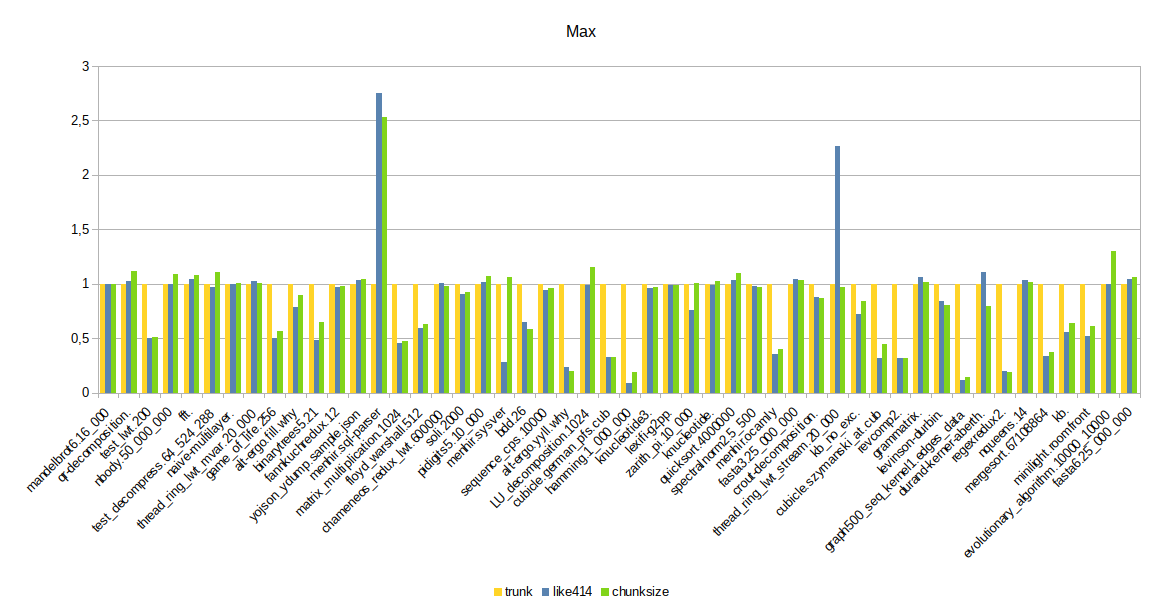
Here are the
Normalized values are computed against trunk value (ie: Full table
The average on all benchmarks:
And some graphs to better visualize the results per benchmark: Mean
|
|
The results look good overall; there are a few regressions in "minimum times", but those are quantities so small that it is not really concerning. On the other hand, |
|
An increase in Having said that, @fabbing and I didn't put much thought into the new value (at least originally, perhaps @fabbing has since then). So there might be a better value to choose. It might also be worth moving the test for interrupts directly into the marking loop - it's pretty cheap, and it would save draining and refilling the prefetch buffer just to check for interrupts. (As a general note: this is one bit of code where performance probably matters more than avoiding duplication. Many OCaml programs spend a double-digit percentage of their time in this function, so optimisation here is more beneficial than almost anywhere else. Refactoring that preserves performance is of course great, but if that turns out to be hard I'd choose the fast and ugly version here) |
|
I edited my previous comment to remove some values from the table and graph. Indeed I tried to get more accurate figures but got them wrong. Sorry about that. Inlining performanceMy last commit (1d30b83) yields better performance than the previous refactoring but not as good as manually inlining Raw table
Table normalized
Graph
Impact of
|
| Chunk size | GC time | Task clock | Cycles | Time |
|---|---|---|---|---|
| 1024 | 0,6979 | 16805,328572 | 30249448592 | 16,806483024 |
| 1280 | 0,6951 | 16732,013482 | 30117479617 | 16,733136599 |
| 1536 | 0,6937 | 16706,811324 | 30072127855 | 16,707922556 |
| 1792 | 0,6871 | 16567,36066 | 29821102200 | 16,568566201 |
| 2048 | 0,6841 | 16495,469809 | 29691704798 | 16,496622062 |
| 2304 | 0,6828 | 16466,350823 | 29639305615 | 16,467323184 |
| 2560 | 0,6814 | 16445,11087 | 29601059354 | 16,44638652 |
| 2816 | 0,6834 | 16474,487396 | 29653951267 | 16,475394348 |
| 3072 | 0,681 | 16421,606056 | 29558744516 | 16,42291328 |
| 3328 | 0,6793 | 16395,230906 | 29511263906 | 16,396623443 |
| 3584 | 0,6769 | 16342,616445 | 29416559047 | 16,343734888 |
| 3840 | 0,6792 | 16384,124633 | 29491275896 | 16,385201654 |
| 4096 | 0,6786 | 16379,60165 | 29483131708 | 16,380887947 |
| 4352 | 0,6762 | 16324,52771 | 29384012068 | 16,325613344 |
| 4608 | 0,6773 | 16351,347737 | 29432286122 | 16,352412785 |
| 4864 | 0,6746 | 16294,414584 | 29329812773 | 16,295357699 |
| 5120 | 0,6766 | 16334,798273 | 29402493093 | 16,335836607 |
| 5376 | 0,6777 | 16348,556629 | 29427252052 | 16,349665815 |
| 5632 | 0,6752 | 16299,866932 | 29339602207 | 16,301248907 |
| 5888 | 0,6736 | 16261,006062 | 29269664349 | 16,262259327 |
| 6144 | 0,6755 | 16325,16908 | 29385158645 | 16,326185925 |
| 6400 | 0,6751 | 16294,153145 | 29329342761 | 16,295169579 |
| 6656 | 0,674 | 16276,200831 | 29297010143 | 16,277461059 |
| 6912 | 0,6747 | 16280,793755 | 29305284957 | 16,282081765 |
| 7168 | 0,6747 | 16291,833534 | 29325172093 | 16,292688599 |
| 7424 | 0,6716 | 16219,457316 | 29194876488 | 16,220700768 |
| 7680 | 0,6762 | 16321,729245 | 29378970165 | 16,322965445 |
| 7936 | 0,6742 | 16276,702341 | 29297925168 | 16,277860709 |
| 8192 | 0,673 | 16248,306974 | 29246795417 | 16,24975623 |
| 8704 | 0,6732 | 16258,789049 | 29265670274 | 16,260099216 |
| 9216 | 0,6767 | 16322,196059 | 29379783405 | 16,324041907 |
| 9728 | 0,6716 | 16228,873859 | 29211847207 | 16,229761962 |
| 10240 | 0,6715 | 16213,640809 | 29184423046 | 16,214532721 |
| 10752 | 0,6733 | 16249,577139 | 29249100762 | 16,250830843 |
| 11264 | 0,6715 | 16220,96639 | 29197603817 | 16,222014844 |
| 11776 | 0,6727 | 16239,63162 | 29231212658 | 16,240520013 |
| 12288 | 0,6736 | 16260,950064 | 29269576454 | 16,262168886 |
| 12800 | 0,6704 | 16195,032308 | 29150928408 | 16,195974763 |
| 13312 | 0,6721 | 16230,044766 | 29213949460 | 16,230952626 |
| 13824 | 0,6731 | 16244,866726 | 29240625767 | 16,245814942 |
| 14336 | 0,6709 | 16202,85012 | 29164995133 | 16,203966744 |
| 14848 | 0,6705 | 16195,705349 | 29152148467 | 16,196400558 |
| 15360 | 0,6725 | 16241,234658 | 29234093471 | 16,242182077 |
| 15872 | 0,671 | 16209,758984 | 29177429382 | 16,210854804 |
| 16384 | 0,6699 | 16183,95254 | 29130970062 | 16,185223053 |
| 16896 | 0,673 | 16246,022189 | 29242698579 | 16,247179946 |
| 17408 | 0,6701 | 16175,515303 | 29115786722 | 16,176731544 |
| 17920 | 0,6717 | 16221,438155 | 29198430208 | 16,223005145 |
| 18432 | 0,6733 | 16256,313798 | 29261245569 | 16,257071129 |
| 18944 | 0,6693 | 16174,134664 | 29113311102 | 16,175170861 |
| 19456 | 0,6709 | 16209,219319 | 29176459096 | 16,210471309 |
| 19968 | 0,6728 | 16237,37891 | 29227151440 | 16,23837567 |
Graph GC time & cycles count

I also ran the micro-benchmarks under olly to get GC pause times. Unlike benchmarks under perf, those are only over one run, so they are probably noisier.
Oddly enough, the increase in Chunk_size doesn't cause an increase in the different GC pause times.
Raw table
| chunk_size | Gc time (s/gc) | mean (ms) | stddev (ms) | min (ms) | max (ms) |
|---|---|---|---|---|---|
| 1024 | 0,691 | 19,7 | 106,48 | 0 | 726,66 |
| 1280 | 0,686 | 19,52 | 105,63 | 0 | 720,37 |
| 1536 | 0,685 | 19,51 | 105,56 | 0 | 719,85 |
| 1792 | 0,677 | 19,33 | 104,35 | 0 | 710,93 |
| 2048 | 0,676 | 19,3 | 104,19 | 0 | 710,41 |
| 2304 | 0,675 | 19,37 | 103,92 | 0 | 707,79 |
| 2560 | 0,674 | 19,23 | 103,86 | 0 | 708,31 |
| 2816 | 0,676 | 19,27 | 104,09 | 0 | 708,84 |
| 3072 | 0,673 | 19,2 | 103,68 | 0 | 706,74 |
| 3328 | 0,671 | 19,15 | 103,32 | 0 | 704,64 |
| 3584 | 0,669 | 19,08 | 102,97 | 0 | 701,5 |
| 3840 | 0,671 | 19,14 | 103,32 | 0 | 704,12 |
| 4096 | 0,672 | 19,17 | 103,46 | 0 | 704,64 |
| 4352 | 0,667 | 19,05 | 102,79 | 0 | 700,45 |
| 4608 | 0,669 | 19,09 | 103,06 | 0 | 702,02 |
| 4864 | 0,666 | 19,02 | 102,56 | 0 | 699,92 |
| 5120 | 0,667 | 19,06 | 102,75 | 0 | 699,92 |
| 5376 | 0,67 | 19,11 | 103,15 | 0 | 703,07 |
| 5632 | 0,667 | 19,15 | 102,66 | 0 | 699,4 |
| 5888 | 0,665 | 19 | 102,46 | 0 | 698,35 |
| 6144 | 0,667 | 19,05 | 102,76 | 0 | 699,92 |
| 6400 | 0,666 | 19,03 | 102,66 | 0 | 699,92 |
| 6656 | 0,665 | 18,99 | 102,42 | 0 | 697,3 |
| 6912 | 0,667 | 19,05 | 102,75 | 0 | 700,45 |
| 7168 | 0,667 | 19,09 | 102,77 | 0 | 699,92 |
| 7424 | 0,666 | 19,02 | 102,59 | 0 | 699,92 |
| 7680 | 0,67 | 19,11 | 103,19 | 0 | 702,55 |
| 7936 | 0,668 | 19,07 | 102,91 | 0 | 701,5 |
| 8192 | 0,667 | 19,05 | 102,77 | 0 | 700,45 |
| 8704 | 0,666 | 19,03 | 102,64 | 0 | 699,4 |
| 9216 | 0,67 | 19,12 | 103,28 | 0 | 703,59 |
| 9728 | 0,667 | 19,16 | 102,73 | 0 | 700,45 |
| 10240 | 0,665 | 19 | 102,47 | 0 | 702,55 |
| 10752 | 0,668 | 19,07 | 102,92 | 0 | 702,55 |
| 11264 | 0,664 | 18,98 | 102,34 | 0 | 697,3 |
| 11776 | 0,665 | 18,98 | 102,4 | 0 | 697,83 |
| 12288 | 0,666 | 19,02 | 102,6 | 0 | 698,88 |
| 12800 | 0,662 | 18,91 | 101,9 | 0 | 694,68 |
| 13312 | 0,664 | 18,96 | 102,23 | 0 | 696,25 |
| 13824 | 0,664 | 18,97 | 102,33 | 0 | 697,3 |
| 14336 | 0,663 | 19,25 | 102,13 | 0 | 696,78 |
| 14848 | 0,664 | 18,98 | 102,29 | 0 | 697,3 |
| 15360 | 0,666 | 19,03 | 102,63 | 0 | 699,4 |
| 15872 | 0,662 | 18,92 | 101,97 | 0 | 694,68 |
| 16384 | 0,661 | 18,9 | 101,83 | 0 | 694,68 |
| 16896 | 0,664 | 18,97 | 102,35 | 0 | 697,3 |
| 17408 | 0,661 | 18,89 | 101,83 | 0 | 693,63 |
| 17920 | 0,662 | 18,93 | 102,02 | 0 | 695,21 |
| 18432 | 0,666 | 19 | 102,54 | 0 | 698,88 |
| 18944 | 0,661 | 18,9 | 101,81 | 0 | 694,16 |
| 19456 | 0,662 | 18,91 | 101,95 | 0 | 694,16 |
| 19968 | 0,664 | 18,96 | 102,25 | 0 | 696,78 |
Graph GC time & max latency

Graph GC time & mean latency

Pathological GC max pause time
I also locally re-ran the menhir.sql_parser and thread_ring_lwt_stream.20_000 benchmarks and confirmed the considerable increase in the max pause time. It affects the prefetching code with either the new Chunk_size or the previous, unmodified one.
I'll try and investigate to understand what happens here.
|
Thanks for running all of these @fabbing . From the GC pause time and runtime data, it looks like there's little reason not to stick with |
|
I re-ran the benchmarks on a different host and the results for |
Co-authored-by: Stephen Dolan <sdolan@janestreet.com>
Co-authored-by: Gabriel Scherer <gasche@github>
55d4161
to
00d9212
Compare
|
I think it's ready to merge. Thanks to all the reviewers. |
|
Has someone done a full review of the patch? (Maybe @sadiqj ? In this case it is best to use the "Approve" feature of Github to make this explicit.) |
|
Sorry @gasche , I did a review but seems I left it as a comment rather than approve. |
This PR restores the prefetching used in 4.14 to speed up the GC marking. See the initial PR Speed up GC by prefetching during marking #10195 for more explanation.
The tracing algorithm with prefetching
prefetch_bufferwithpb_popif it's filled enough (pb_above_waterline) for the prefetching to have completed.mark_entryfrom the block fields.mark_entryfrom themark_stack.mark_stackbeing empty, set theprefetch_bufferto draining mode withpb_drain, and try again. The marking is complete if theprefetch_bufferis already in draining mode.mark_entry, adding them to theprefetch_bufferwithpb_push. Blocks that can't be prefetched because theprefetch_bufferis full (pb_full) are added back to themark_stack.Changes to 4.14 implementation
The
prefetch_buffer_ttype is introduced to hold implementation details for the prefetch ring buffer.prefetch_buffer_toperations have their own set of associated inline functions (pb_*) to increase readability.A
waterlinemember is added to theprefetch_buffer_tstruct acting as themin_pbin 4.14.Calling the function
pb_drainto set theprefetch_buffer_tin draining mode is equivalent to setting thewaterline(min_pbpreviously) to 0. Likewise, callingpb_fillresets it to filling mode, setting thewaterlinetoPREFETCH_BUFFER_MIN(Pb_minpreviously).The
prefetch_buffer_tis reset to filling mode (pb_fill) as soon it's filled with more thanPREFETCH_BUFFER_MINelements.Also, the
Chunk_sizewas increased from0x400to0x4000to better use theprefetch_buffer.Performance
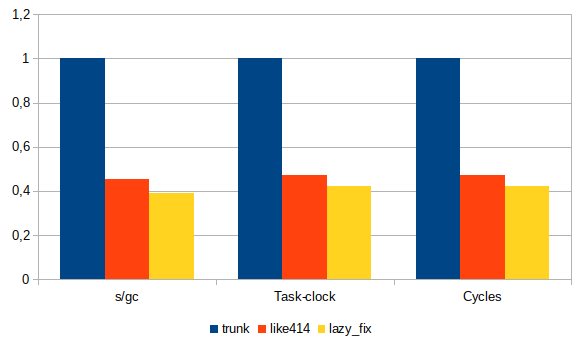
Using @stedolan micro-benchmark (using
GC.majorratherGC.full_major) yields as good performance as 4.14:Acknowldgement
Thanks to @stedolan for his help, @ctk21 and @sadiqj for their advice, and @Engil for the initial bootstrap.