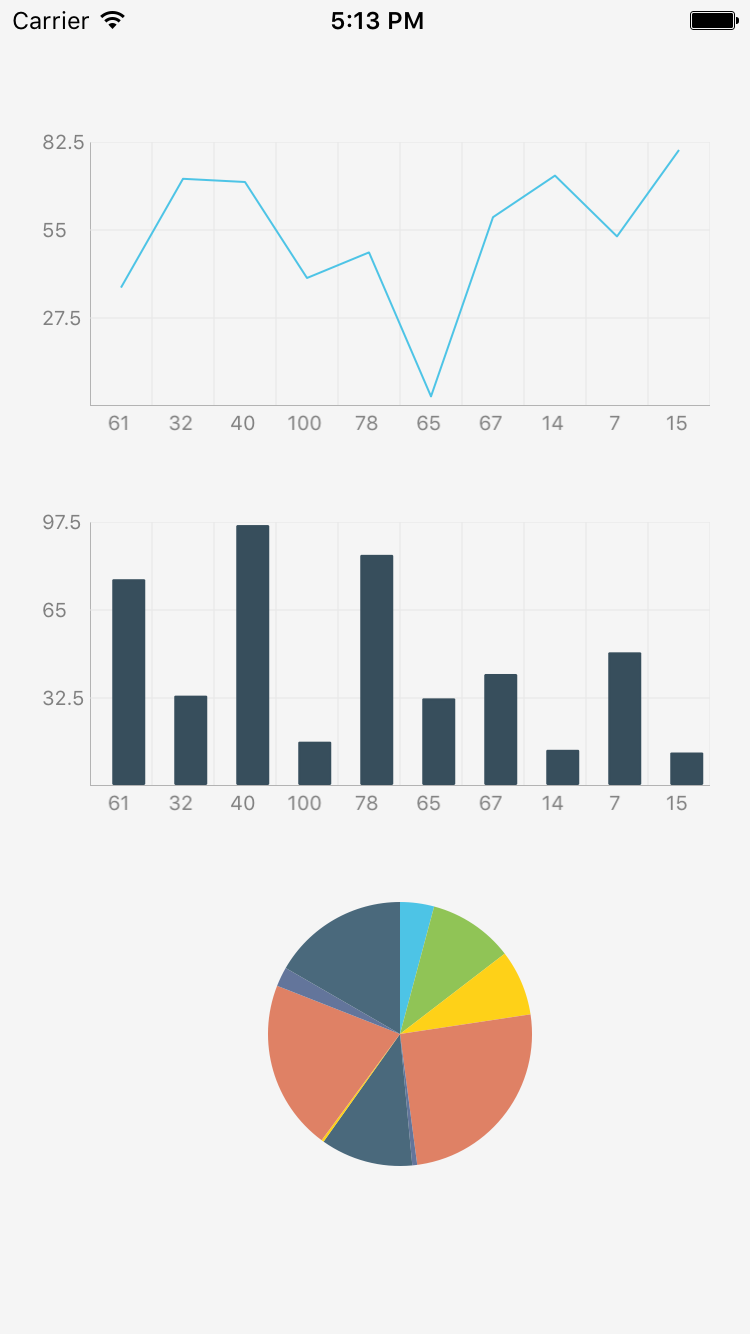
react-native-chart is a simple module for adding line charts, area charts, or bar charts to your React Native app.
-
npm install react-native-chart --save -
I recommend using rnpm for linking.
2a.
npm install -g rnpm2b.
rnpm link
If you'd rather not use rnpm, you can link the library as described here.
import React, { StyleSheet, View, Component } from 'react-native';
import RNChart from 'react-native-chart';

const styles = StyleSheet.create({
	container: {
		flex: 1,
		justifyContent: 'center',
		alignItems: 'center',
		backgroundColor: 'white',
	},
	chart: {
		position: 'absolute',
		top: 16,
		left: 4,
		bottom: 4,
		right: 16,
	}
});

const chartData = [
	{
		name: 'BarChart',
		type: 'bar',
		color:'purple',
		widthPercent: 0.6,
		data: [30, 1, 1, 2, 3, 5, 21, 13, 21, 34, 55, 30],
	},
	{
		name: 'LineChart',
		color: 'gray',
		lineWidth: 2,
		highlightIndices: [1, 2],	// The data points at indexes 1 and 2 will be orange
		highlightColor: 'orange',
		showDataPoint: true,
		data: [10, 12, 14, 25, 31, 52, 41, 31, 52, 66, 22, 11],
	}
];

const xLabels = ['0','1','2','3','4','5','6','7','8','9','10','11'];

class SimpleChart extends Component {
	render() {
		return (
			<View style={styles.container}>
				<RNChart style={styles.chart}
					chartData={chartData}
					verticalGridStep={5}
					xLabels={xLabels}
				 />
			</View>
		);
	}
}All properties are optional otherwise noted
-
chartData(ObjectArray) - : one nested block produces one type of chartdata- (NumberArray) - Y axis values / Requiredname- (String) - name of the plottype- (String) - "line" or "bar" / Default: line"fillColor- (String/Color) - Line chart only: area fill color / If not specified, the line will not be filledlineWidth- (Float) - Line chart only: line width / Default: 1.0widthPercent- (Float) - Bar chart only: [0 - 1.0], 0.1 means very skinny, 1.0 means bars touch each other / Default: 0.5showDataPoint- (Boolean) - show or hide the data points / Default: falsedataPointColor- (String/Color) - outline color of the data point / Default: bluedataPointFillColor- (String/Color) - fill color of the data point / Default: bluedataPointRadius- (Float) - the radius of the data point / Default: 1.0cornerRadius- (Float) corner radius of the bars in a bar chart / Default: 1.0 / If 0, it will be completely rectangular.highlightColor- (String/Color) - the color of the highlighted data points at the highlight indices. this will overridedataPointColoranddataPointFillColor.highlightIndices- (NumberArray) - the indices to apply thehighlightColorhighlightRadius- (Float) - the radius of a highlighted data point / Default: 1.0sliceColors(Array) - array of colors for the pie chart slices. matched by index with thechartData.dataarray. if fewer specified, remaining slices will be blue for now. Required for pie chart
-
animationDuration(Float) - duration of the animation in seconds / Default: 0.3 -
axisColor(String/Color) - color of the X and Y axes / Default: lightgray -
axisLineWidth(Float) - width of the axis line / Default: 1 -
axisTitleColor(String/Color) - color of the title of the axes / Default: gray -
axisTitleFontSize(Integer) - font size of axis titles / Default: 10 -
chartTitle(String) - title of the chart -
chartTitleColor(String/Color) - color of the chart title / Default: gray -
gridColor(String/Color) - color of the grid / Default: lightgray -
gridLineWidth(Float) - width of the grid line / Default: 0.5 -
hideHorizontalGridLines(Boolean) - hides the horizontal grid lines when showGrid is true / Default: false -
hideVerticalGridLines(Boolean) - hides the vertical grid lines when showGrid is true / Default: false -
labelFontSize(Integer) - font size of axis labels / Default: 10 -
labelTextColor(String/Color) - text color of axis labels / Default: gray -
showAxis(Boolean) - show or hide axis / Default: true -
showGrid(Boolean) - show or hide grid / Default: true -
showXAxisLabels(Boolean) - show or hide axis labels for the X axis / Default: true -
showYAxisLabels(Boolean) - show or hide axis labels for the Y axis / Default: true -
tightBounds(Boolean) - constrict Y axis to min/max of values instead of max/minning with 0 / Default: false -
verticalGridStep(Integer) - number of Y axis grids / Default: 3 -
xAxisTitle(String) - Title for the x-axis -
xLabels(StringArray) - array of all X axis label strings. This determines the X-axis grid as well. Need to match the number of input data inchartData/ Required -
yAxisTitle(String) - Title for the y-axis
- Needs touch support
- Needs legend
- Stack Bar Chart
- Multi Line Chart
- Scatter/Bubble chart
- Testing w/ Travis CI
Work prior to repo transfer on Feb 1, 2015 was the work of Hyun Cho @ OneFold.
Email tom.auty@gmail.com for support.

