Skip to content
New issue

Have a question about this project? Sign up for a free GitHub account to open an issue and contact its maintainers and the community.

By clicking “Sign up for GitHub”, you agree to our terms of service and privacy statement. We’ll occasionally send you account related emails.

Already on GitHub? Sign in to your account

Prisma Memory Leak when using in NestJS app, reported by Jest #17925

Closed
adrian-goe opened this issue Feb 14, 2023 · 59 comments
Closed

Prisma Memory Leak when using in NestJS app, reported by Jest #17925

adrian-goe opened this issue Feb 14, 2023 · 59 comments

Comments

@adrian-goe
Copy link

Bug description

In our (closed source) project, we added a lot of test for a new feature. That resulted in memory problems in our ci.

We found, that Prisma is might be one of the problems.
I created a minimal reproduction https://github.com/adrian-goe/prisma-nestjs-memory-leak-repoduction

There is one test without using prisma app.controller.spec.ts
and one using prisma app-prisma.controller.spec.ts

running both test with node --expose-gc and jest --detectLeaks results in jest finding memory leaks in the test with prisma.

It might be possible, that this leaks also happens while running the application, but I didn't test that.

It could be possible, that this is a nestJs problem as well, but we ware only be able to reproduce this with Prisma, but no other dependency or module.

How to reproduce

https://github.com/adrian-goe/prisma-nestjs-memory-leak-repoduction

Expected behavior

No response

Prisma information

see https://github.com/adrian-goe/prisma-nestjs-memory-leak-repoduction

Environment & setup

  • OS: [macOS, Windows, Debian] might be more
  • Database: [PostgreSQL] only tested with postgres
  • Node.js version: v16.18.0

Prisma Version

prisma                  : 4.10.1
@prisma/client          : 4.10.1
Current platform        : darwin-arm64
Query Engine (Node-API) : libquery-engine aead147aa326ccb985dcfed5b065b4fdabd44b19 (at node_modules/@prisma/engines/libquery_engine-darwin-arm64.dylib.node)
Migration Engine        : migration-engine-cli aead147aa326ccb985dcfed5b065b4fdabd44b19 (at node_modules/@prisma/engines/migration-engine-darwin-arm64)
Format Wasm             : @prisma/prisma-fmt-wasm 4.10.1-1.80b351cc7c06d352abe81be19b8a89e9c6b7c110
Default Engines Hash    : aead147aa326ccb985dcfed5b065b4fdabd44b19
Studio                  : 0.481.0

In our internal project, this was also an issue with Prisma 4.1.1

@adrian-goe adrian-goe added the kind/bug A reported bug. label Feb 14, 2023
@mcbethio mcbethio added bug/1-unconfirmed Bug should have enough information for reproduction, but confirmation has not happened yet. topic: prisma generate CLI: prisma generate topic: memory leak team/schema Issue for team Schema. topic: postgresql labels Feb 14, 2023
@SevInf
Copy link
Contributor

SevInf commented Feb 14, 2023

Hi @adrian-goe. One problem I find with you reproduction - I don't see prisma.$disconnect call. This is necessary for prisma to clean up all associated resources. Ensure it is gets called after every test suite where prisma is used.

Second problem: when node run with --expose-gc Jest has a known memory leak. This is not prisma-specific problem. Couple of workarounds are suggested in that thread. Most reliable seems to be adding --no-compilation-cache option to node.

@adrian-goe
Copy link
Author

adrian-goe commented Feb 14, 2023

@SevInf oh i forgot the app.close call in the test. I will add that alter. But in our production code we have this in every that case.

The jest problem you mentioned, wouldn't this also affect the other test as well?

@adrian-goe
Copy link
Author

@SevInf also, i have a prisma Service class. This is provided in the module that extends the OnApplicationShutdown hook from nestjs, so it should correctly shut down, when nestJs shuts down.
Might not be the case in my reproductio, since i forgot the explicit app.close() call.

@SevInf
Copy link
Contributor

SevInf commented Feb 14, 2023

@adrian-goe PrismaService class in your reproduction does not call $disconnect either. I am not NestJS expert by any means, but I am pretty sure it does not know anything about Prisma and won't call it automatically for you. If that's not the case in your production app and $disconnect is called there, please, update the reproduction to reflect that.

Also, try --no-compilation-cache flag to test for Jest leak as well. I, unfortunately, can't tell if it should happen with the other test. We've seen quite a dramatic memory usage spike in our own test suite when --expose-gc is used, however. We could not reproduce it outside of Jest sandbox so we have all reason to believe that the issue I've linked is the reason.

@adrian-goe
Copy link
Author

@SevInf I added the --no-compilation-cache flag, the issue remains.

I also added the app.close()in the after all block. Also, I added console.logs to the onApplicationShutdown method, in my prisma service. This method is called. Since my service extends the PrismaClient class, the await this.$disconnect(); should disconnect prisma correctly, as you mentioned.

@janpio janpio added topic: performance/memory team/client Issue for team Client. and removed team/schema Issue for team Schema. labels Feb 17, 2023
@janpio
Copy link
Member

janpio commented Feb 17, 2023

So I can confirm that the reproduction outputs the following message:

gitpod /workspace/prisma-nestjs-memory-leak-repoduction (main) $ npm run test:leak

> prisma-memory-leak@0.0.0 test:leak
> node --expose-gc ./node_modules/.bin/jest --config=apps/prisma-memeory-leak/jest.config.ts --verbose --no-compilation-cache --detectLeaks --runTestsByPath ./apps/prisma-memeory-leak/src/app/app-prisma.controller.spec.ts

  console.log
    before prisma close

      at Proxy.<anonymous> (src/app/prisma/prisma.service.ts:6:13)

  console.log
    after prisma close

      at Proxy.<anonymous> (src/app/prisma/prisma.service.ts:8:13)

 FAIL   prisma-memeory-leak  apps/prisma-memeory-leak/src/app/app-prisma.controller.spec.ts
  ● Test suite failed to run

    EXPERIMENTAL FEATURE!
    Your test suite is leaking memory. Please ensure all references are cleaned.

    There is a number of things that can leak memory:
      - Async operations that have not finished (e.g. fs.readFile).
      - Timers not properly mocked (e.g. setInterval, setTimeout).
      - Keeping references to the global scope.

      at onResult (../../node_modules/@jest/core/build/TestScheduler.js:190:18)
      at ../../node_modules/@jest/core/build/TestScheduler.js:316:17
      at ../../node_modules/emittery/index.js:260:13
          at Array.map (<anonymous>)
      at Emittery.emit (../../node_modules/emittery/index.js:258:23)

Test Suites: 1 failed, 1 total
Tests:       0 total
Snapshots:   0 total
Time:        2.355 s
Ran all test suites within paths "./apps/prisma-memeory-leak/src/app/app-prisma.controller.spec.ts".
Segmentation fault

I also sent a PR to make the reproduction actually work out of the box: adrian-goe/prisma-nestjs-memory-leak-repoduction#1

Note: Even though this is now on confirmed, it does not mean there has to be a problem at Prisma. We will keep investigating that.

@janpio janpio added bug/2-confirmed Bug has been reproduced and confirmed. and removed bug/1-unconfirmed Bug should have enough information for reproduction, but confirmation has not happened yet. labels Feb 17, 2023
@Durisvk
Copy link

Durisvk commented Apr 25, 2023

Hey guys I'm currently debugging a memory-leak on our production app (which is not using NestJS but a similar approach of extending PrismaClient + typedi package).

I've noticed from your reproduction that if I print out heapUsed before the query and after the query on the latest version of prisma it's really leaking by fraction of a megabyte.

However if I downgrade to prisma@3.0.2 the memory goes down after the query (the test still fails because there might be some open handles or some other stuff).

image

To reproduce follow the steps in README.md and adjust the file apps/prisma-memeory-leak/src/app/app-prisma.controller.spec.ts to the following:

import { Test, TestingModule } from '@nestjs/testing';
import { AppController } from './app.controller';
import { PrismaModule } from './prisma/prisma.module';
import { AppPrismaController } from './app-prisma.controller';
import { AppPrismaService } from './app-prisma.service';

describe('AppPrismaController', () => {
  let app: TestingModule;

  beforeAll(async () => {
    app = await Test.createTestingModule({
      imports: [PrismaModule],
      controllers: [AppPrismaController],
      providers: [AppPrismaService],
    }).compile();
  });

  afterAll(async () => {
    await app.close();
  });
  describe('getData', () => {
    it('should return "Welcome to prisma-memeory-leak!"', async () => {
      const appController = app.get<AppPrismaController>(AppPrismaController);

      console.log(
        `before querying ${
          Math.round((process.memoryUsage().heapUsed / 1024 / 1024) * 100) / 100
        } MB`
      );
      expect(await appController.getData()).toEqual({
        message: 'Welcome to prisma-memeory-leak!',
      });

      console.log(
        `after querying ${
          Math.round((process.memoryUsage().heapUsed / 1024 / 1024) * 100) / 100
        } MB`
      );
    });
  });
});

Then run the following commands:

npm i --save prisma@3.1.1 @prisma/client@3.1.1
npx prisma generate

see the memory increase:

before querying 203.91 MB
after querying 206.72 MB

then downgrade to prisma@3.0.2:

npm i --save prisma@3.0.2 @prisma/client@3.0.2
npx prisma generate

and run the tests again:

before querying 212.83 MB
after querying 202.25 MB

The changelog between 3.0.2 and 3.1.1 versions can be found here: https://github.com/prisma/prisma/releases/tag/3.1.1

And here's a comparison between 3.0.2 and 3.1.1:
3.0.2...3.1.1

And here's a comparison between prisma-engines versions
prisma/prisma-engines@3.0.2-dev.1...3.1.1

@Durisvk
Copy link

Durisvk commented Apr 25, 2023

So I can confirm that the reproduction outputs the following message:

gitpod /workspace/prisma-nestjs-memory-leak-repoduction (main) $ npm run test:leak

> prisma-memory-leak@0.0.0 test:leak
> node --expose-gc ./node_modules/.bin/jest --config=apps/prisma-memeory-leak/jest.config.ts --verbose --no-compilation-cache --detectLeaks --runTestsByPath ./apps/prisma-memeory-leak/src/app/app-prisma.controller.spec.ts

  console.log
    before prisma close

      at Proxy.<anonymous> (src/app/prisma/prisma.service.ts:6:13)

  console.log
    after prisma close

      at Proxy.<anonymous> (src/app/prisma/prisma.service.ts:8:13)

 FAIL   prisma-memeory-leak  apps/prisma-memeory-leak/src/app/app-prisma.controller.spec.ts
  ● Test suite failed to run

    EXPERIMENTAL FEATURE!
    Your test suite is leaking memory. Please ensure all references are cleaned.

    There is a number of things that can leak memory:
      - Async operations that have not finished (e.g. fs.readFile).
      - Timers not properly mocked (e.g. setInterval, setTimeout).
      - Keeping references to the global scope.

      at onResult (../../node_modules/@jest/core/build/TestScheduler.js:190:18)
      at ../../node_modules/@jest/core/build/TestScheduler.js:316:17
      at ../../node_modules/emittery/index.js:260:13
          at Array.map (<anonymous>)
      at Emittery.emit (../../node_modules/emittery/index.js:258:23)

Test Suites: 1 failed, 1 total
Tests:       0 total
Snapshots:   0 total
Time:        2.355 s
Ran all test suites within paths "./apps/prisma-memeory-leak/src/app/app-prisma.controller.spec.ts".
Segmentation fault

I also sent a PR to make the reproduction actually work out of the box: adrian-goe/prisma-nestjs-memory-leak-repoduction#1

Note: Even though this is now on confirmed, it does not mean there has to be a problem at Prisma. We will keep investigating that.

I've created a new issue where there's a reproduction with no other dependency but Prisma.

Technically I cannot call it a memory leak but I am for sure calling it a memory mismanagement.

My feeling is that the following commit is causing it: f395aba but that's just a feeling since I know the prisma infrastructure is super complex and I'm not a Rust developer.

I hope it helps in your investigation.

@xlmnxp
Copy link

xlmnxp commented Jun 19, 2023

we face same issue with Prisma and nestjs, even calling prisma.collection.delete catch memory leak and invalid pointers etc...

malloc(): unaligned tcache chunk detected

@xlmnxp
Copy link

xlmnxp commented Jun 19, 2023

So I can confirm that the reproduction outputs the following message:

gitpod /workspace/prisma-nestjs-memory-leak-repoduction (main) $ npm run test:leak

> prisma-memory-leak@0.0.0 test:leak
> node --expose-gc ./node_modules/.bin/jest --config=apps/prisma-memeory-leak/jest.config.ts --verbose --no-compilation-cache --detectLeaks --runTestsByPath ./apps/prisma-memeory-leak/src/app/app-prisma.controller.spec.ts

  console.log
    before prisma close

      at Proxy.<anonymous> (src/app/prisma/prisma.service.ts:6:13)

  console.log
    after prisma close

      at Proxy.<anonymous> (src/app/prisma/prisma.service.ts:8:13)

 FAIL   prisma-memeory-leak  apps/prisma-memeory-leak/src/app/app-prisma.controller.spec.ts
  ● Test suite failed to run

    EXPERIMENTAL FEATURE!
    Your test suite is leaking memory. Please ensure all references are cleaned.

    There is a number of things that can leak memory:
      - Async operations that have not finished (e.g. fs.readFile).
      - Timers not properly mocked (e.g. setInterval, setTimeout).
      - Keeping references to the global scope.

      at onResult (../../node_modules/@jest/core/build/TestScheduler.js:190:18)
      at ../../node_modules/@jest/core/build/TestScheduler.js:316:17
      at ../../node_modules/emittery/index.js:260:13
          at Array.map (<anonymous>)
      at Emittery.emit (../../node_modules/emittery/index.js:258:23)

Test Suites: 1 failed, 1 total
Tests:       0 total
Snapshots:   0 total
Time:        2.355 s
Ran all test suites within paths "./apps/prisma-memeory-leak/src/app/app-prisma.controller.spec.ts".
Segmentation fault

I also sent a PR to make the reproduction actually work out of the box: adrian-goe/prisma-nestjs-memory-leak-repoduction#1
Note: Even though this is now on confirmed, it does not mean there has to be a problem at Prisma. We will keep investigating that.

I've created a new issue where there's a reproduction with no other dependency but Prisma.

Technically I cannot call it a memory leak but I am for sure calling it a memory mismanagement.

My feeling is that the following commit is causing it: f395aba but that's just a feeling since I know the prisma infrastructure is super complex and I'm not a Rust developer.

I hope it helps in your investigation.

I see they backport the commit to all major releases!

@xlmnxp
Copy link

xlmnxp commented Jun 19, 2023

@adrian-goe I notice both of us use arm64
Is it related to that bug?

@adrian-goe
Copy link
Author

@xlmnxp since this is also a problem in our CI, that don't use arm64, it is probably not related to this.

@xlmnxp
Copy link

xlmnxp commented Jun 19, 2023

@xlmnxp since this is also a problem in our CI, that don't use arm64, it is probably not related to this.

Hmm, we have same issue,
it was working fine, but I don't know what break

@xlmnxp
Copy link

xlmnxp commented Jun 19, 2023

@adrian-goe I find something wired that if the issue happen once, then I cannot start nestjs and got one of the following

malloc(): unaligned tcache chunk detected
malloc(): unaligned fastbin chunk detected
malloc_consolidate(): unaligned fastbin chunk detected
free(): double free detected in tcache 2

@xlmnxp
Copy link

xlmnxp commented Jun 19, 2023

I think related to #18510

@Nickersoft
Copy link

Has anyone come across a workaround for this? I'm noticing a very slow memory leak in my production server that causes a crash after 1-2 weeks. In my local debugging Prisma seems to come up pretty often in my heap dumps.

@RisbergAdam
Copy link

We're also seeing a very clear memory leak in prisma, staring somewhere between version 4.3.1 and 4.12.0. The amount of leaked memory seems to depend on the amount of queries made with prisma, with some of our high-load services running out of memory in a day or two.

@eJayYoung
Copy link

eJayYoung commented Jul 13, 2023

Same problem
We're also seeing a slow rss increase in a long days by prometheus, the maximum difference between Shallow Sizeand Retained Size in heapdump snapshot point to node_modules/@prisma/client/runtime/library.js

and I found there is a WeakRef in LibraryEngine.ts

try {
      // Using strong reference to `this` inside of log callback will prevent
      // this instance from being GCed while native engine is alive. At the same time,
      // `this.engine` field will prevent native instance from being GCed. Using weak ref helps
      // to avoid this cycle
      const weakThis = new WeakRef(this)
      this.engine = new this.QueryEngineConstructor(
        {
          datamodel: this.datamodel,
          env: process.env,
          logQueries: this.config.logQueries ?? false,
          ignoreEnvVarErrors: true,
          datasourceOverrides: this.datasourceOverrides,
          logLevel: this.logLevel,
          configDir: this.config.cwd,
          engineProtocol: 'json',
        },
        (log) => {
          weakThis.deref()?.logger(log)
        },
      )
}

I'm not sure is WeakRef not be GCed cause the memory leak

Forward the reply

@mmmeff
Copy link

mmmeff commented Sep 11, 2023

In case folks missed it, this looks like its related to using Prisma on Node 16/18. Updating to Nodejs v20 fixed the memory leak for my team.

@adrian-goe
Copy link
Author

adrian-goe commented Sep 13, 2023

@mmmeff I tested it with the reproduction, i posted. That did not fix it.

Node: 20.6.1
Prisma: 5.2.0

@janpio I pushed it on a seperate branch https://github.com/adrian-goe/prisma-nestjs-memory-leak-repoduction/tree/node20

edit: here is a PR with a test pipline: adrian-goe/prisma-nestjs-memory-leak-repoduction#3

@janpio
Copy link
Member

janpio commented Sep 13, 2023

Thanks for anticipating my next question @adrian-goe and delivering the answer 🙇

Can you do the same @whalesync-ryder maybe?

@janpio
Copy link
Member

janpio commented Sep 13, 2023

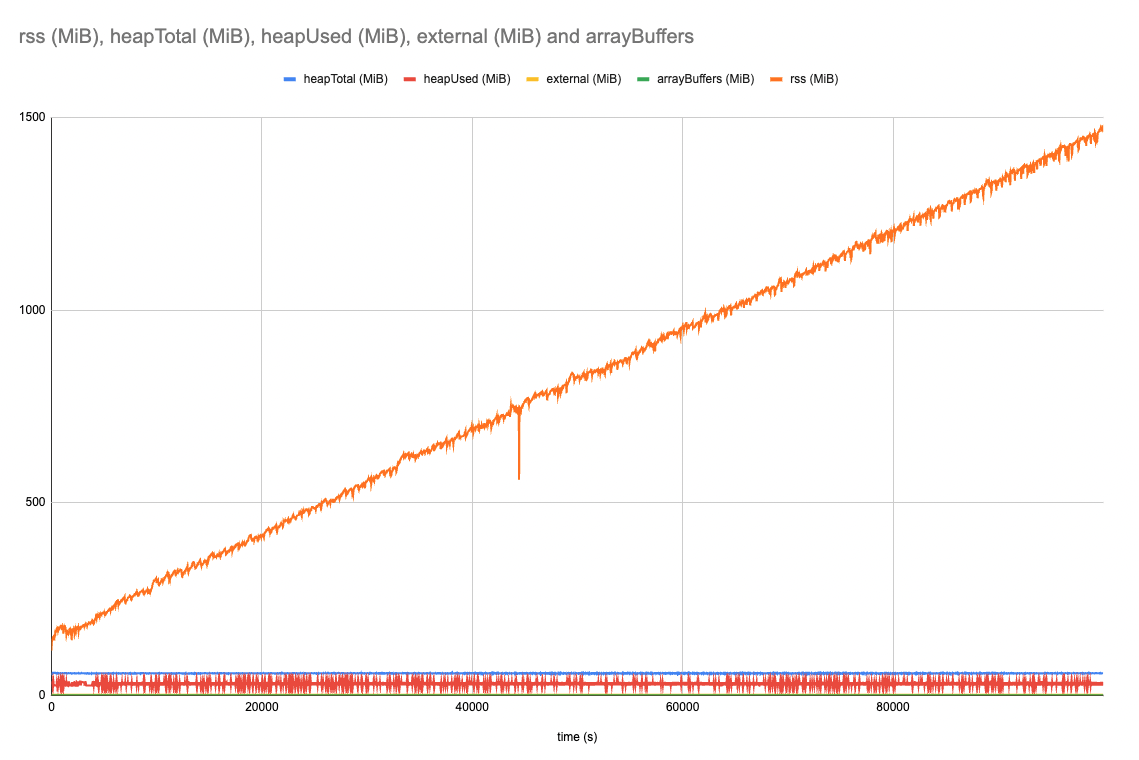
@whalesync-ryder This is what 6 hours on Node.js 18.17.1 look like for me with your reproduction, run on GH Actions: https://github.com/janpio/prisma-leak-demo/actions/runs/6171034510/job/16748486361:

image Slight increase over time in RSS.

@whalesync-ryder
Copy link

@janpio Thanks for running it, i had a background task running this morning that found similar results. It's 10x better on node 20:

Node 16.13.0: Increases at 47. MB/hour
Node 20.6.1: Increases at 4.4 MB/hour

@janpio
Copy link
Member

janpio commented Sep 14, 2023

My result for 6 hours of node 16.13.0:
image
https://github.com/janpio/prisma-leak-demo/actions/runs/6178409890/job/16771583251

@whalesync-ryder
Copy link

@janpio Very interesting! So you're not seeing any difference. Maybe I had something else going on to explain the 10x difference in leak speed between my two runs. I can't imagine what it would be.

@justinhandley
Copy link

justinhandley commented Sep 20, 2023

I believe that we are also experiencing this - I can't give source code publicly, but I am happy to add a few developers to our repo for research purposes if that helps. Nest.js - Node 18 - Prisma, deployed on Heroku, crashes out with heap allocation about once per day.

@janpio
Copy link
Member

janpio commented Sep 20, 2023

Thanks for the offer, but we have a few general apps that run out of memory with "just keep it running with normal production level traffic" - that is super hard to reproduce for us. Optimal would a minimal reproduction that clearly shows how memory is leaking. The more obvious, the easier it is for us to figure out what is going on.

@r-moore
Copy link

r-moore commented Sep 20, 2023

I'm sorry I know this is not a particularly helpful comment, but we're definitely getting the same issues as described above in production too.

For now we're also restarting everything regularly with pm2.

Can't share too much other info about our setup on here, but if someone from prisma wants to reach out I can spare some time.

@pocesar
Copy link

pocesar commented Sep 28, 2023

using Prisma 5.3.1 and Node.js 20.6 decreased the amount of restarts per day to 0.25, which is a major improvement from the daily / twice restarts

@martinliptak
Copy link

I needed to run a script to import around 12 million records.

await db.record.findUnique({
    select: {
      id: true,
    },
    where: {
      id: key,
      updatedAt: { gte: lastModifiedDate },
    },
  })

Runing this query on Prisma 5.4.1 and NodeJS 18.12.0 was causing a memory leak. A simple script running only this query would consume all server memory and crash. Optimizing it with $queryRaw didn't help. Then I tried calling the raw query with pg 8.11.3 on Nodejs 18.12.0 and got normal memory consumption so the problem was with Prisma 5.4.1 on NodeJS 18.12.0. I upgraded to NodeJS 20.8.0 and tested the original findUnique on Prisma 5.4.1 - this solved the problem. The server is running Debian GNU/Linux 10 (buster), but the same thing was happening on Mac OS X.

Screenshot 2023-10-11 at 12 34 54 PM

@Jolg42
Copy link
Member

Jolg42 commented Nov 1, 2023

Hello 👋🏼 I'm working through posts here and reproductions attempts.

Note for @adrian-goe
I tried to run your repro using a Codespace on GitHub, using the Node.js version from nvmrc https://github.com/adrian-goe/prisma-nestjs-memory-leak-repoduction/tree/node20?rgh-link-date=2023-09-13T08%3A39%3A57Z
But the "proof" which is supposed to not leak memory, is actually reporting a leak, see below
Screenshot 2023-11-01 at 17 08 55

@Jolg42 Jolg42 self-assigned this Nov 2, 2023
@Jolg42

This comment was marked as outdated.

@Jolg42
Copy link
Member

Jolg42 commented Nov 8, 2023

I wrote a very simple sample app and left it running over the weekend and I believe it repros the issue. The code is here: whalesync-ryder/prisma-leak-demo

Here's the memory over 27 hours: Screen Shot 2023-09-11 at 11 58 56 AM

Let me know if you have any questions, hope that helps! Edit: forgot to mention running on node v16.13.0. (which we need to upgrade from but you know)

@whalesync-ryder I could reproduce finally using Node.js v16, the reproduction in GitHub Actions was missing yarn prisma db push at first, so previous reproductions were actually not executing any queries, they were all failing because the database didn't exist.

Did you upgrade to v18 or v20 already? This problem looks only related to Node.js v16 (which is "end of life") to me at the moment, see results:

Note:

  • I used --max-old-space-size to show how rss is actually reclaimed and growing rss is not a problem in itself, as long as it's reclaimed when there is some memory pressure.

Using nest start


Using yarn run build and then node dist/main

Notes:

@whalesync-ryder
Copy link

I am in the process of upgrading my node right now, so i should be able to confirm pretty soon if that resolved it for me. Thanks for the info.

@tavindev
Copy link

Can confirm: Upgrading to Node v20 and Prisma v5.5.2 fixed the leak for me. Previously, memory usage would increase to 2GB within a few hours. Now, it remains at approximately 600MB over the same time span.

@whalesync-ryder
Copy link

Same here, my issues have been resolved since the node upgrade.
5.5.2 & Node 18.18.2
Thanks to whoever fixed it, accidentally or on purpose!

@r-moore
Copy link

r-moore commented Nov 17, 2023

Same - had a few weeks without issue since the upgrade, seems to be fixed!

@livthomas
Copy link

I still experience memory leaks with Prisma 5.5.2 on both Node.js 18.18.2 and 20.10.0.

@Druue
Copy link
Contributor

Druue commented Jan 2, 2024

Hey @livthomas we'll need further information to be able to help you at all.
Ideally, a minimal reproduction repro of the issue would be best (schema, js/ts code, query data). It would be greatly beneficial if you could share what exactly is going wrong, specific error messages, specific outcomes you're running into, and if possible, any graphs / data that indicate a memory leak (or high memory usage). Here's an example of what I mean per graphs / data for profiling such issues.

@Jolg42
Copy link
Member

Jolg42 commented Jan 4, 2024

Hello here, thanks for the updates! We're very happy to see that Upgrading to Node.js v18+ solved the issue for you 🙌🏼

We will now close this, here are a some notes about some things that were discussed here.

Like we found in #13575, about Jest --detectLeaks, it is an experimental feature, which is undocumented, and from our experience it's too often unreliable. You can see that similar results can be obtained without using Prisma.

Note that Prisma 5 got big performance improvements, like the internal protocol switch, which uses less RAM, for more details see https://www.prisma.io/blog/prisma-5-f66prwkjx72s
So we definitely recommend everyone to upgrade to Prisma 5.

The memory leak in this issue was confirmed when using Node.js v16, which is now End-Of-Life.
So we recommend everyone to upgrade to Node.js v18 or better v20, as it is the current LTS.


If you have a reproduction where a memory leak can be observed with a recent version of Prisma, please open a new issue with a reproduction, we will be happy to investigate and try to reproduce.
If it's related to using Jest, make sure to compare using Prisma and without Prisma, as the problem might be visible without using Prisma.


As a general note, when creating an issue, let us know if what you see is excessive memory usage or something that looks like a memory leak.

  • In case of a memory leak, the memory usage would steadily go up when repeating the same query many times.
  • In case of excessive memory usage, the memory usage would not increase over time, but only spike when the query is running. In this case, it could be that too much data is returned from the database and using a limit like take: 10 to specify how many objects should be returned.

I hope I can create a code template in the future with some guidelines to help with identifying potential memory leaks in the future (to be done).

@Jolg42 Jolg42 closed this as completed Jan 4, 2024
@GrinZero
Copy link

This seems to have some effect on me, thank you all

@Jolg42
Copy link
Member

Jolg42 commented Jan 16, 2024

@GrinZero Just curious, could you give some details about what you modified, and what effect you see?

@GrinZero
Copy link

@GrinZero只是好奇,您能否详细说明您修改的内容以及您看到的效果?

Update somethings:

  • NestJs ^8 => ^10
  • Prisma ^3 => ^5
  • Node ^16 =>^20

I use prom-client and grafana to monitor memory.

Before Update:
image

After Update:
image

Sign up for free to join this conversation on GitHub. Already have an account? Sign in to comment
Projects
None yet
Development

No branches or pull requests