Memory mismanagement (leak) since version 3.9 #18934
Comments
|
Here's a comparison between the two releases that made a marginal contribution to issue being introduced: And here's a commit I suspect introduced the issue: f395aba but don't take it for granted (it's just my personal feeling). Since I've spent last few weeks in regarding |
|
Hi @Durisvk, thanks for opening this issue: we're heavily working on improving the performance of Prisma as a whole. |
|
Hey @jkomyno. Here's the memory progression with Just to add more context - the prisma schema contains 1 model with 2 fields. The database table is empty and I am calling the same I see the In our application we have multiple scheduled jobs which are querying the database every minute and this is how the memory consumption looks for 7 days:
not great, right? |

|
@aqrln the typescript is not relevant in this case. The reproduction is set up in plain javascript |
|
@Durisvk the label doesn't mean the problem is related to typescript itself, it only means that it's related to the part of Prisma codebase written in TypeScript (as opposed to the engines written in Rust) and needs TypeScript engineers to look into it, and it's relevant to anything that happens in the JavaScript land. I added the label because your report shows the JavaScript heap usage growth. |
|
Hey, updates here. I've pulled your repo and put memory logs around the following line: I believe this line is referring the query to the native Rust libquery-engine here: And it generates Then after a few thousand queries, it drops some memory, fortunately. It appears the problem is happening in the native part of the system. Now I'm not a Rust expert and I also don't know how the V8 process manages the memory of a natively bound module but I believe it's shared since it's imported as a regular Node module. Should I open this issue in https://github.com/prisma/prisma-engines repo so that Rust engineers can write some memory tests around that query function? @SevInf @jkomyno I see you guys are quite involved in the native part of the system - can you assist here? Our production is crashing over and over again and I've fixed all the other leaks involved so the only one left is Prisma. |
|
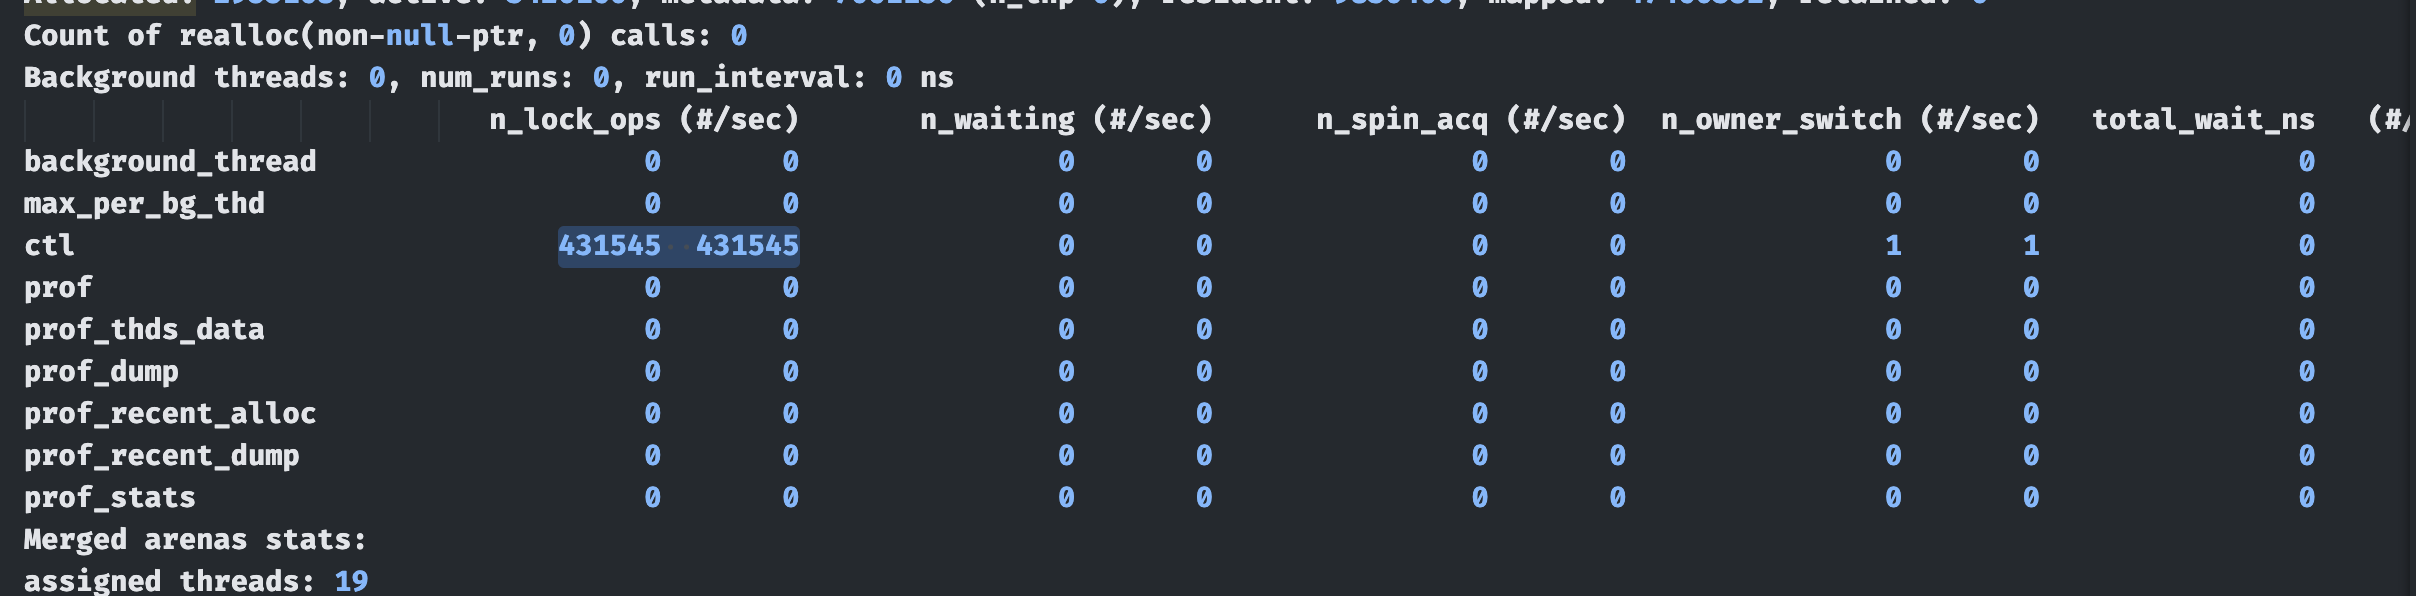
New update here. Just added a and so on. The only thing increasing here is the time spent ctl n_lock_ops: anyways, so the problem is not in native prisma-engines. However before calling the native engine and after calling the native engine the memory usage increases by 853 bytes even though the result coming from the query engine has only 23 bytes. And it only goes up from there until it reaches some point (double or triple the initial memory usage with an empty query) and then it drops. Could it be some strange caching mechanism of |
|
Something to verify that: Add |
|
@Durisvk could you also try running your reproduction with lower |
|
Yeah, you were right, the memory progression looks much better with Thank you for clarifying. You can close this issue. |
Bug description
There is an issue with how Prisma allocates a memory for a single query being called multiple times.
Running the same query for 10000 times produces the following
process.memoryUsage().heapUsedon the latest version of Prisma:I recommend checking https://github.com/Durisvk/prisma-memory-mismanagement-reproduction/blob/main/README.md for more details.
A little context:
I am currently debugging a memory leak issue on production. A memory leaks in between the requests. However when I try to use
--inspectmode in NodeJS I am unable to tell whether the memory is still leaking or it's just Prisma's weird memory management.I believe the issue is also related to this: #17925 but we can't technically call it a leak because the memory after a few tens of thousands cycles falls down without a Heap out of memory issue (even though it grows by the factor of 3.34x at its worst in the meantime)
How to reproduce
Follow the steps in README
See how the memory management differs
Expected behavior
No response
Prisma information
// Add your schema.prisma// Add your code using Prisma ClientEnvironment & setup
Prisma Version
But also with
Then the deltas become smaller but the memory is mostly growing rather than going down (even though a single query is being called repeatedly).
The text was updated successfully, but these errors were encountered: